
We’re proud to debut a new cyclical piece, The ETFSector.com Macro Trend Signals for Sector Positioning. This piece leverages the results of historical trend studies we feature on our research page to decipher likely implications for GICS Sector returns based on historical coincident return profiles. This data is meant to provide a reference scenario for where to harvest excess returns by aligning with identifiable trends in macro-level financial market trends like the direction of the S&P 500, the US 10yr Treasury Yield, The Blomberg Commodities Index or the USD/DXY Index.
Current Equity Trend: UP
The S&P 500 is our US equity trend proxy. Currently it charts an unambiguous uptrend and has made numerous all-time highs over the past 2 months. Current risks are tactical as the Index is in a clear overbought condition. We expect a potential correction to be in the realm of a 10% drawdown based on where near-term support is on the S&P 500 price chart. Strong trends are typically accumulated on pullbacks.
The current trend for the S&P 500 is up. The historical mean sector excess return profile during uptrends back to 1989 favors Info Tech., Financials, Real Estate and Discretionary Sectors.

Comparing the historical averages for S&P 500 uptrends to the current 1yr returns, we see some striking similarities. Since 7/11/2023, the S&P 500 has advanced 26.62% while the Info. Tech. Sector has gained 36.64%. Both totals align with historical averages. The displacement in the present cycle comes from the new composition of the Comm. Services Sector influenced by Mag7 heavyweights META and GOOG/L. Those stocks remain among the strongest charts, and we are willing to concede that the Comm. Services sector is likely a source of Growth and upside alpha if those two stalwart stocks remain in bull trends.
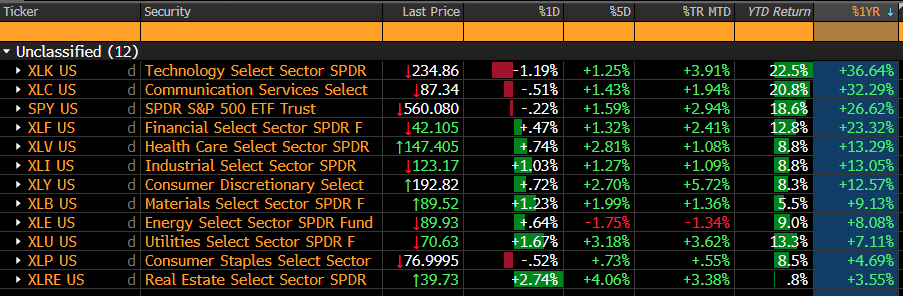
Beyond the exceptional performance of the XLC, we can observe that despite the narrow outperformance profile of the sectors, they show a significant amount of conformity between the present cycle and their historical return profile in equity uptrends. XLRE is an outlier to the downside and the XLV has ranked higher than its historical average, but the XLK leads as expected.
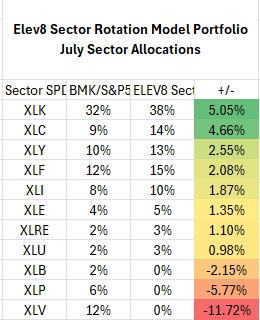
In our Elev8 Sector Rotation Model XLK, XLF, XLY, XLC and XLRE get positive signal from confirmed equity uptrends based on this input. XLC is negative in the deep history data but has been a strong outperformer over the last two uptrend cycles post inclusion of META, GOOG/L, NFLX, DIS etc. in the last GICS Sector reconstitution. See below:

Current US 10yr Yield Trend: Transition–Downward Bias Near-term
While the equity trend is clear at present, interest rates as measured by the US generic 10yr yield are in a sideways consolidation with increasingly distributional characteristics. That has us giving a mild benefit of the doubt to sectors that benefit from falling rates, but we ended June without a clear signal in our Elev8 portfolio model. With the 10yr yield making a new 3-month low today (currently at 4.175%) we are heading towards a downtrend signal for August in the model.
Looking at the technical we see a near-term oversold condition for the 10yr Yield. Near-term support is likely around 4.05% which is the bottom of the price congestion zone for the consolidation. Below that level is potential for increased downside momentum. The MACD Oscillator is also signaling downtrend (negative value) and is putting in a short-term sell signal on its signal-line downside crossover.
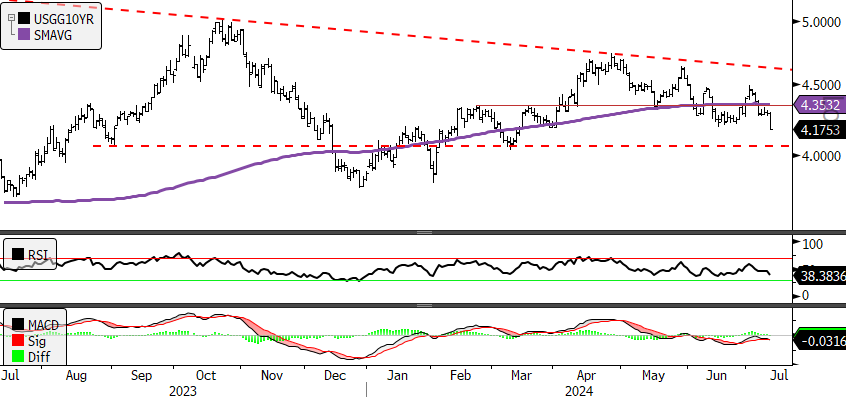
The weekly 3yr chart for the 10yr Yield also shows a longer-term negative momentum divergence which is a characteristic of a distributional (topping) pattern. We can also see that motive upside thrusts in the yield have been losing steam as the inflation impulse has sputtered.
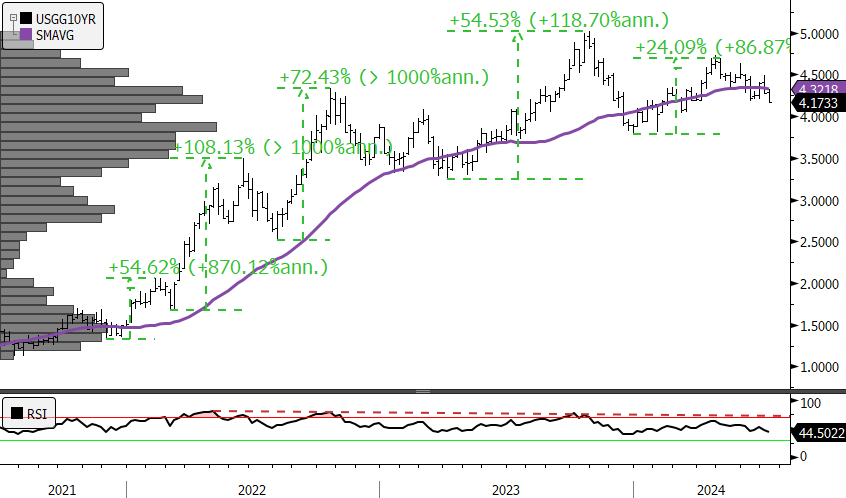
Given these technical characteristics we think the long-term direction of rates is likely lower. However, the overlay in the present cycle is to realize that lower rates will likely offer relief to the broad array of underperforming Sectors that have lagged due to inflation/recession fears. This is a crosscurrent that is hard to sus out in our model but keeps us a bit reserved in positioning for a traditional lower rate playbook.


Conclusion: Equity Trend is Strong, Interest Rate Trend Transitioning Lower
Expect some near-term crosscurrents as equities readjust to the potential that rates will spend 2025 with a 3-handle rather than a 4 handle. Given all the pent-up recession fears, lower rates may benefit cyclicals in the short-term, but they have historically been a persistent tailwind to lower vol. areas of the market over high beta.
Given the strength of the Equity trend we have our sector model more aligned to XLK and XLC and our biggest complementary bets are in XLY and XLF. Please keep an eye out for our next macro note where we will discuss our Commodities and USD model inputs.
Links to our studies on coincident sector returns during uptrends and downtrends in these benchmarks can be found here:
US Sector Historical Return Profiles During Equity Uptrends – ETF Sector
US Sector Historical Return Profiles During Equity Downtrends – ETF Sector
US Sector Historical Return Profiles During Interest Rate (US 10yr Yield) Uptrends – ETF Sector
US Sector Historical Return Profiles During Interest Rate (US 10yr Yield) Downtrends – ETF Sector
US Sector Historical Return Profiles During USD Price (DXY Index) Uptrends – ETF Sector
US Sector Historical Return Profiles During USD Price (DXY Index) Downtrends – ETF Sector
Sources: Bloomberg
