
ETF Insights | November 1, 2024 | Materials Sector
Price Action & Performance
Using the XLB as a proxy for price action, we can see that investors couldn’t sustain the rally off the July lows. Resistance developed at the $98 level and the sector ended the month with a whimper, trading down to fresh 3-month relative lows.
At the industry level we continue to see a mixed bag. Metals and Mining lagged the S&P 500 by 10% in October after entering the month looking constructive. Construction Materials stocks were the best performers during October as discounting there appears to have run its course. The Chemicals Industry, the largest in the sector, lagged the benchmark S&P 500 in October, driven lower by some earnings season stumbles. At the stock level we were compelled to downgrade some of our previous favorite names like LIN, ECL, DOW and SHW.
At the stock level VMC and MLM were upgrades and the aforementioned chemical co.’s were downgraded in the past month. We like PKG and we think ALB, CF, APD and EMN are improving stocks in the Chemicals space. Materials stocks, like the sector, have struggled to sustain positive momentum and we attribute that to the failing bid for commodities prices. Historically investor interest in Commodities has correlated strongly with Materials and Energy Sector outperformance. Any shift there would impact our indicators positively, but at present, we aren’t seeing it.
Economic and Policy Drivers
The boost to Materials stocks from interest rate policy announcements was short lived. Whether due to supply chain re-integration post lowering pricing power or just an aggregate lack of demand from the manufacturing complex, we are seeing very little investor interest in positioning for higher Commodities prices.
With the Fed signaling continued intent to support the Consumer and the Main Street economy moving forward, we are now seeing the other side of the “sticky inflation” dynamic. Each positive piece of economic data now seems to put upwards pressure on Yields and the 10yr Treasury Yield has now backed up from 3.6% to 4.3%. Things will get complicated for the FOMC if markets continue to buck policy goals for lower rates and financing costs. Mortgage rates are still too high to unclog the housing market, and the lack of affordability could keep wage pressures higher for operating companies in the Consumer and Industrial sectors of the economy.
The outcome of the US election would likely have some impact on the Materials Sector’s prospects as Former President Trump’s import tariffs in 2017 benefitted US producers but raised costs for consumers. Trump also enacted the Tax Cuts and Jobs Act of 2017 which allowed businesses to immediately expense 100% of the cost of eligible properties, which is a potential boon for capital intensive industries within the sector. Trade agreements like the tri-lateral USMCA will be worth watching as well. Vice President Harris has mentioned housing affordability as a major goal of here administration, however economists warn that here efforts to boost consumer buying power through tax credits and subsidies may exacerbate inflation issues. In short, both candidates are offering inflationary policy platforms whether by tariff or transfer payment.
In Conclusion
The Materials Sector continues to lag the S&P 500 and we aren’t seeing the salubrious effects of dovish interest rate policy that we had hoped. Commodities prices remain in the tank. While we should be vigilant for an exogenous catalyst, investors have preferred Financials, Comm Services, and Discretionary stocks. The “Soft Landing” scenario is consensus.
Materials stocks showed some signs of life entering November but failed to sustain it. Our model inputs rank Materials in the bottom 3 and assigns it a zero-weight position for October. Our Elev8 Sector Portfolio starts October with a -2.23% UNDERWEIGHT in Materials vs. the S&P 500 Index.
Chart | Materials Sector Technicals

- XLB 12-month, daily (200-day moving average | XLB Relative to SPX |14-day RSI | 12, 26, 9 MACD)
- XLB near-term bullish reversal failed in October as Commodities prices rolled over.
XLB Relative Strength vs. S&P 500: Sector and Industry Level | Trailing 3-months
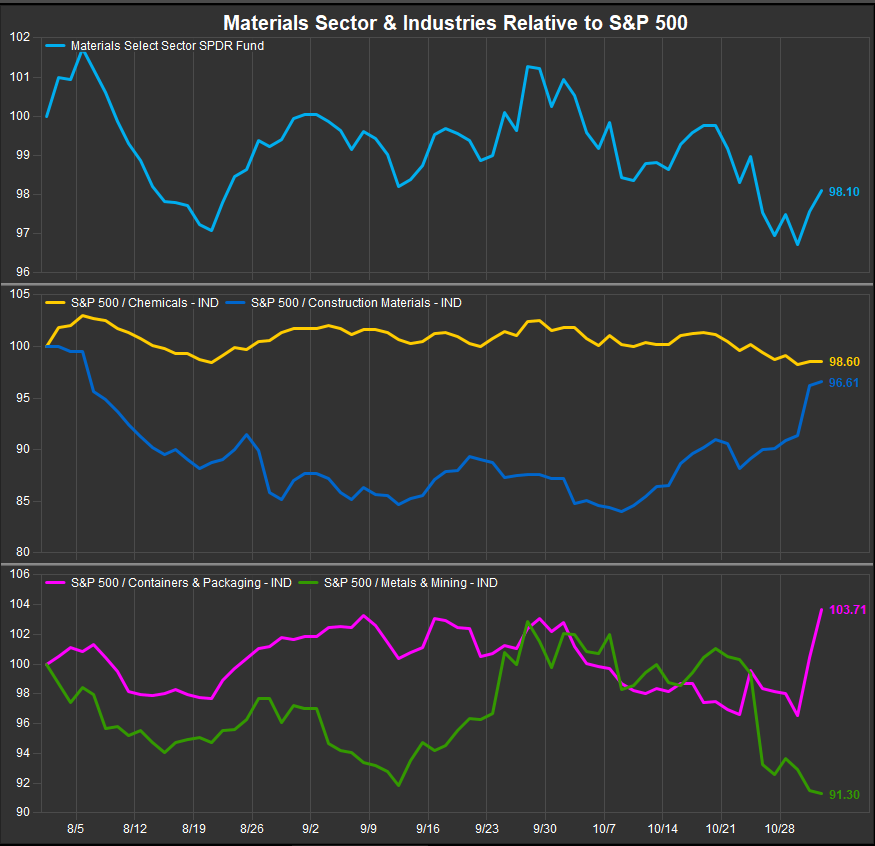
Data sourced from FactSet Research Systems Inc.
