


Given that the Fed has embarked on an interest rate easing cycle and signaled intention to continue cuts past the first two already enacted, we decided to take a look back at easing and tightening cycles in the modern era. This will not be an exhaustive study, but we looked back at the Fed Funds Target rate from 1971 to the present. The trajectory of the policy rate can be observed in the chart below.
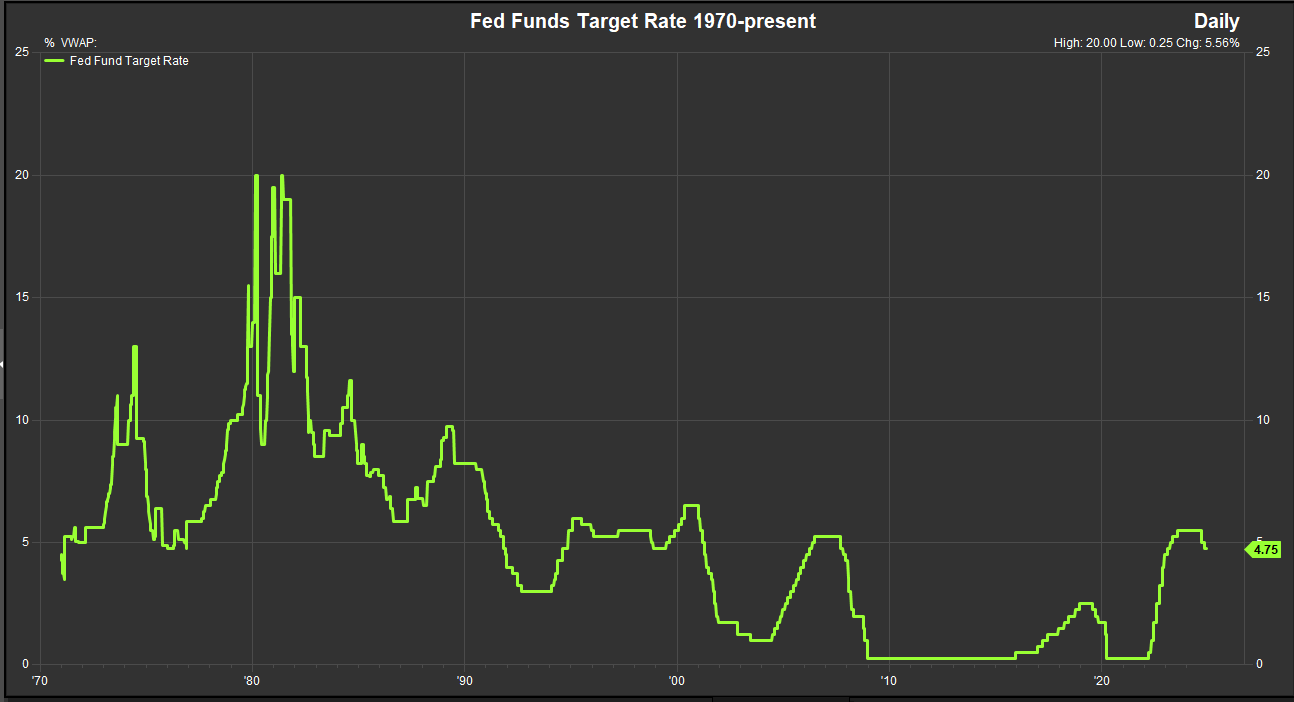
Before we get too deep in the weeds, here are some high-level observations. Since the year 2000, easing and tightening cycles have been contiguous sequences. Prior to the year 2000 the FOMC demonstrated a less deliberate approach to managing the policy rate. As can be seen, it fluctuated with much more volatility from 1970-1990, particularly from 1978-1982 as Fed Chairman Pual Volcker raised the rate to 20% to get ahead of runaway inflation that plagued markets and the economy during the 1970’s.
The largest single hike during the period of study was 5.25%, bringing the Fed Funds Target rate to 20% for the first time on February 25, 1980. There were 3% hikes in 1981 and 1982 as well. The early 80’s saw (comparatively) wild moves to the downside as well. The Target rate was lowered a record 9% on April 1, 1980, after spending just over 1 month at that 20% level, Chairman Volcker lowered the rate to 11%. Rates were cut by 5.5% on November 2, 1981, after rates had been elevated to 20% for a 2nd time in an 18-month period. Rates were normalized in 3 big steps from 1980-1990, but unlike the last 20+ years, cuts would be interrupted by hikes sporadically as there was tension between the Fed’s dual mandate to support the real economy and fight inflation.
When we break down equity and bond market performance around the 1st rate cut going back to 1980 the forward simple return profile for the 16 observations on record look like this:

But if we just look at the last 5 cycles from 1995-present the average forward returns are starkly different.

Where the deeper data set sports above average positive returns for 1, 3, 6 and 12-month periods, more recent easing cycles have taken longer to develop. This is partially due to the Fed’s own behavior, as the FOMC’s propensity to whipsaw the policy rate in the 80’s makes it challenging to interpret how one should view 1 hike in February of 1985 that occurred between 5 cuts between September 1984 and December 1984 and subsequently 4 more cuts after between March 1985 and July 1985. This give and take was a common occurrence in the 80’s.
Our Sector data goes back to 1994. It allows us to examine forward returns from the past 5 easing cycles that had at least 3 cuts to get forward returns. We also compare returns for the S&P 500, Russell 2000, S&P MidCap, S&P Small Cap, Bloomberg Agg Bond Index and Bloomberg Commodities Index returns for a basis of comparison. Here are the returns from 1995-present after the Fed’s first cut of an easing cycle.

Forward returns were generally positive with the I/T and Discretionary Sectors outperforming. Real Estate, Utilities and Energy Sectors lagged generally in the past 5 cycles. Real Estate performance should be taken with a grain of salt though as the sector was formed in 2002. The two easing cycles where we have complete sets of forward return data for Real Estate are the GFC easing cycle and the pre-pandemic easing cycle. Real Estate got obliterated following both of those cycles.
Below are forward returns for sectors and major indices after the 2nd rate cut from 1995 to present.

Broad market results were tepid with most gains accruing to the Information Technology Sector. Discretionary, Healthcare and Materials were the only other sectors that appreciated over the next 12 months.
As the Fed is now considering its 3rd cut of the cycle, here is the forward return profile for the last 5 cycles that made it to a 3rd cut.
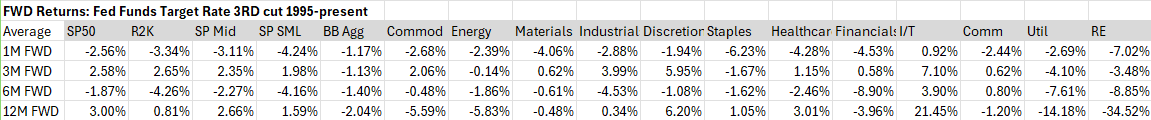
Since 1995, the 3rd cut has seen negative 1-month and 6-month forward returns. Commodities prices remain in a negative trajectory and high yield sectors are deep laggards, though those numbers are lower than expected as these results are based on simple return, but the 3rd cut in an easing cycle is not the time to go long low vol. exposures or commodities. With interest rates on the rise in the near-term and commodities prices dormant, we aren’t itching to buy those things anyways right now.
Patrick Torbert, Editor & Chief Strategist, ETFSector.com
Week in Review: Sectors
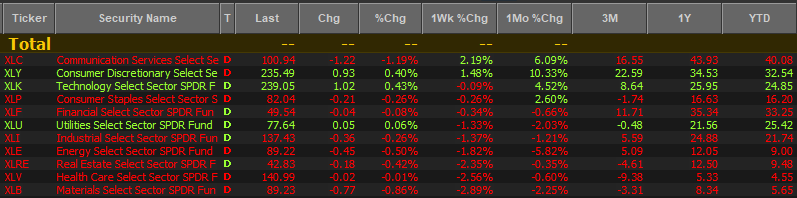
The past week (measured from Monday’s close to Friday’s close) saw YTD winners ahead of YTD laggards. Communications Services was the best performing sector, adding 2.19% while Consumer Discretionary stocks continued their 2nd half surge adding 1.48% and moving into the 3rd spot among the 11 sectors for YTD performance.
Interest Rates Moving Higher Again
Breadth narrowed in December after a strong November. Our factor work has shown Growth re-taking the driver’s seat after Donald Trump’s election briefly sparked the bull to accumulate more broadly. With the S&P 500 now trading above the 6000 level and just a couple of weeks away from logging a >28% return on the year so far, we note that interest rates are again creeping higher. Risk gages are firm, but VIX and MOVE our equity and bond volatility indices are at lows for the year. We don’t like this level of complacency, and we think rates above 4.75% would be a catalyst for selling in the equity market. A move above 4.5% would have us taking some risk-on exposure out of our portfolio in anticipation of a larger upside move from rates.
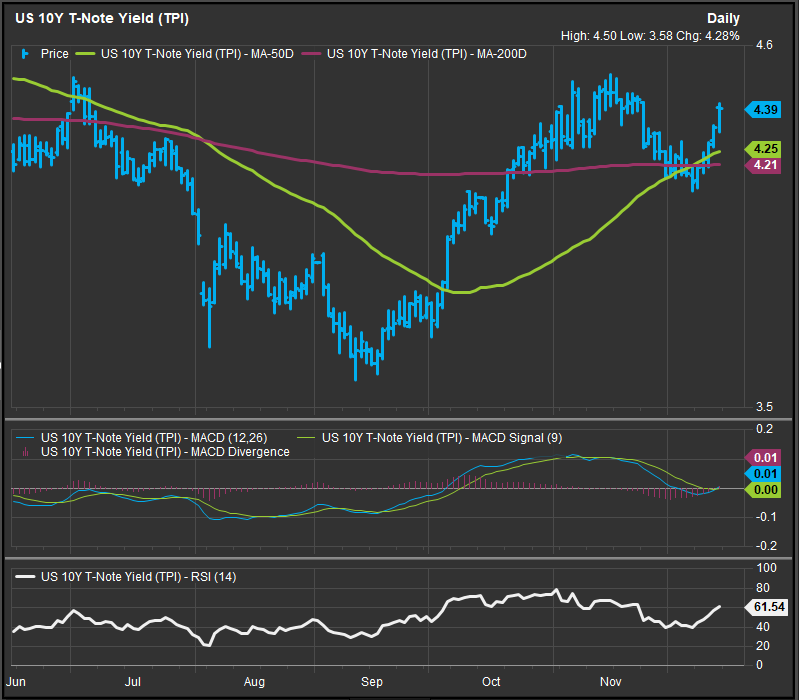
We think a move above the 4.5% level corresponding to the November highs, would be concerning for the equity advance, particularly Growth leadership. We encourage investors to pay close attention to rates into year-end as they could pinch the consumer, raise real estate acquisition and construction cost, and complicate the Fed’s policy goal of supporting the consumer and the main street economy.
Data sourced from Factset Research Systems Inc.
