US equities have moved a lot but gone basically nowhere over the past three weeks. These consolidations, especially if they are volatile, can be problematic for a trend-following portfolio allocation model like Elev8. It is the nature of trend following strategies that pivot points for trend change are also ideal accumulation points if the current trend continues to prevail. We are using this space today to recap our January trade decisions in hopes of providing our fellow investors with some insights and ideas on how to adjust when a model is sending unproductive signals.
We’ve executed two trades since January 1st. Since we monitor key support and resistance levels for the S&P 500, Commodities, US 10yr Yield and USD as macro inputs into our trading model, we had two signals and made two trades over that time. We took risk out of the portfolio on January 10th, as the US 10yr Yield broke out above an important resistance level to the upside. We then closed that trade at the end of the day on January 22nd as the S&P 500 reconfirmed the bull trend for equities trading to a new all-time high.
January Trades (Notional Position Values Shown)
We started January giving the bull market the benefit of the doubt despite rising rates. Prior to their upside break-out on January 10, rates had been rising, but were in a longer-term trading range and we had expected them to roll over to begin 2025. We aligned the Elev8 portfolio expecting bullish accumulation on softening rates.
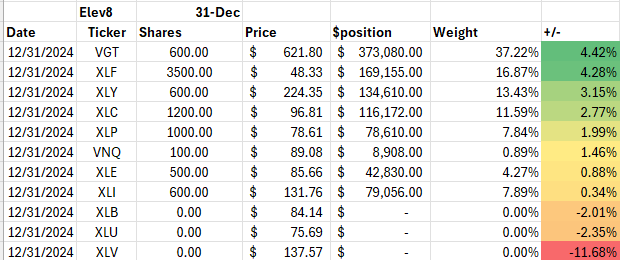
Starting Position, December 31, 2024
Market Close, January 10:
Signal: US 10yr Yield breaks out above intermediate-term resistance at the 4.67-4.7% level (chart below)
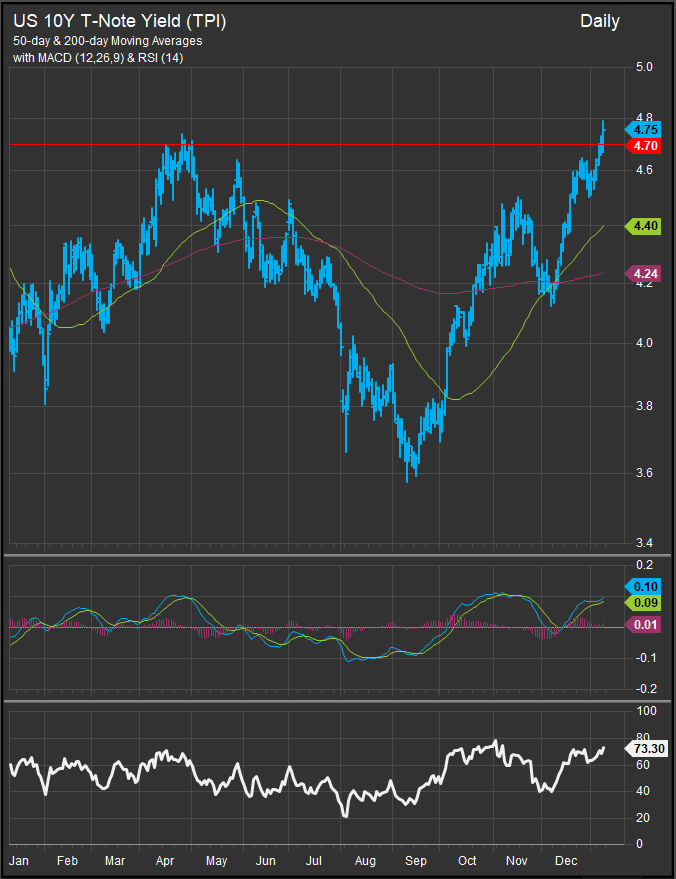
Interpretation: Rates broke out to the upside against a backdrop of weaker equities (deteriorating breadth, momentum). We expected the move to trigger a deeper top line correction for equities along with rotation away from sectors that have high concentrations of Growth stocks like Technology, Comm. Services and Consumer Discretionary. With commodities prices also firming, we were looking for investors to shift to a 2022 playbook in the near-term.
Sell: 600 shares XLF, 200 shares XLC, 600 shares XLY, 100 shares VGT, 100 shares VNQ
Buy: 1000 shares XLV, 700 shares XLU, 100 shares XLP, 100 shares XLE
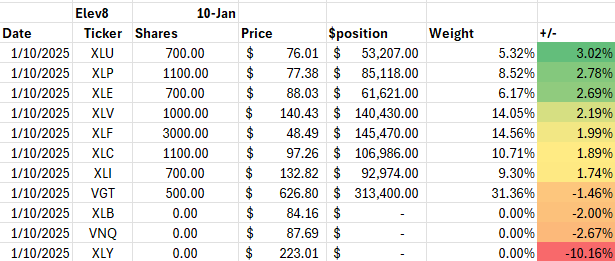
Elev8 Positions, January 10 Close:
Market Close, January 22:
Signal: S&P 500 breaks out to new all-time high, Tech Sector makes new all-time high, SOX index makes multi-month high
Interpretation: Context is important. Equities have been in a clear and obvious bull trend since early/mid 2023. New all-time highs for major equity indices are signs of optimism. The primary bull trend was confirmed by the all-time closing high. We are potentially dealing with a bull market that can handle higher rates.
Sell: 1100 shares XLP
Buy: 100 shares VGT, 400 shares XLB
Rationale: Since XLP shares had offered no haven during the previous week of equity market turbulence, they were sold so we could add upside exposure though Technology and Commodities-linked cyclicals. We rotated out of our full Discretionary position because we have technical and fundamental concerns about the consumer’s ability to flourish with rates staying in the mid-4% range. We will finish January without any Consumer exposure.
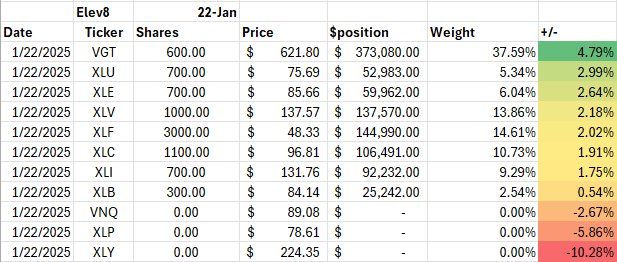
Elev8 Positions, January 22 Close:
Strategic Adjustments?
Macro signals are included in the Elev8 model selection process to compliment and add conviction to stock level signals. The direction of interest rates and equities has been particularly important in this cycle as thematic leadership within equities has shifted with them. When rates are falling and equities are rising, Growth is typically preferred. When rates are rising and equities are falling, Value, laggards and smaller stocks are preferred generally. We’ve been using these dynamics to adjust our sector exposures in combination with our primary signals from the underlying stocks themselves.
We relied more heavily on these indicators in January because equities were in consolidation with weak market internals. As a result of weak market breadth, our individual stock work was trending more negative on every sector except the Energy sector as we entered January. This was either an ideal accumulation point or an ideal exit point if the primary trend is changing. Once rates broke out with equities at near-term lows, we thought we had our answer, and the bear was going to take control of the tape. As that thought has since proven incorrect, we pick up the pieces of a bad trade. How do we mitigate similar whip-saws in the future? And would we be guilty of over indexing to the past or “curve-fitting” if we tweak our process on every sub-optimal result?
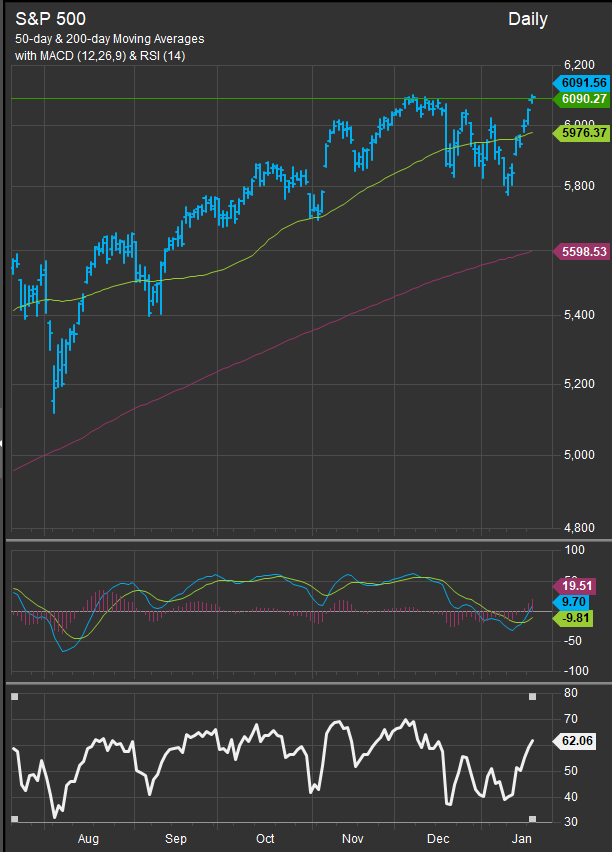
When reviewing our suite of indicators and signals, we found our one legitimate critique of the trade was allowing our anxiety over rising rates to make us a drop too hasty in pulling the trigger. The chart below shows, 3-months of S&P 500 daily price bars. On January 10, the closing price did not break below our identified support zone for the broader consolidation. As seen on the chart below we had ID’d the bottom of the November 5, 2024 “price gap” as a key support for the following upwards price move. Price dipped below that level intra-day but closed above it. We traded with a small amount of anticipation and that ended up costing us in the near-term.
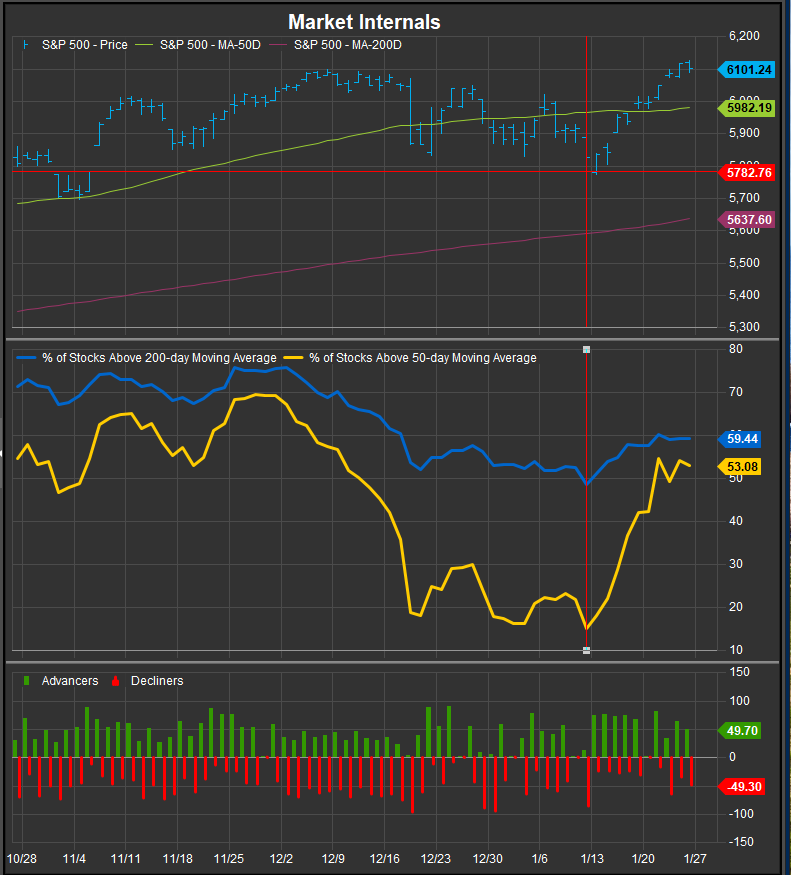
Our takeaway is a time-tested one. Be diligent in adhering to your investment process. Mistakes at the margines are mistakes we need to weed out to give ourselves the best chance at long-term success. An indicator that is moving towards a signal is not a foregone conclusion that it will produce a signal, and we shouldn’t front run it even by a small margin. What is difficult about this is that increased uncertainty makes this discipline even more important, not less. A strong trend deserves the benefit of the doubt, and important thresholds show up in charts for good reasons. They can offer an edge if we are disciplined. We were facing 4th and 1 just inside opposition territory. We punted, but on closer review, the charts were saying go for it.
Patrick Torbert, Editor & Chief Strategist, ETFSector.com
Data sourced from FactSet Research Systems Inc.
