We talked last week about negative economic data finally being interpreted as a negative by equity investors, and how the Yield Curve wouldn’t be a leading indicator for recession this time around (Narrations of a Sector ETF Operator | Weekly Market Letter, August 4, 2024 – ETF Sector).
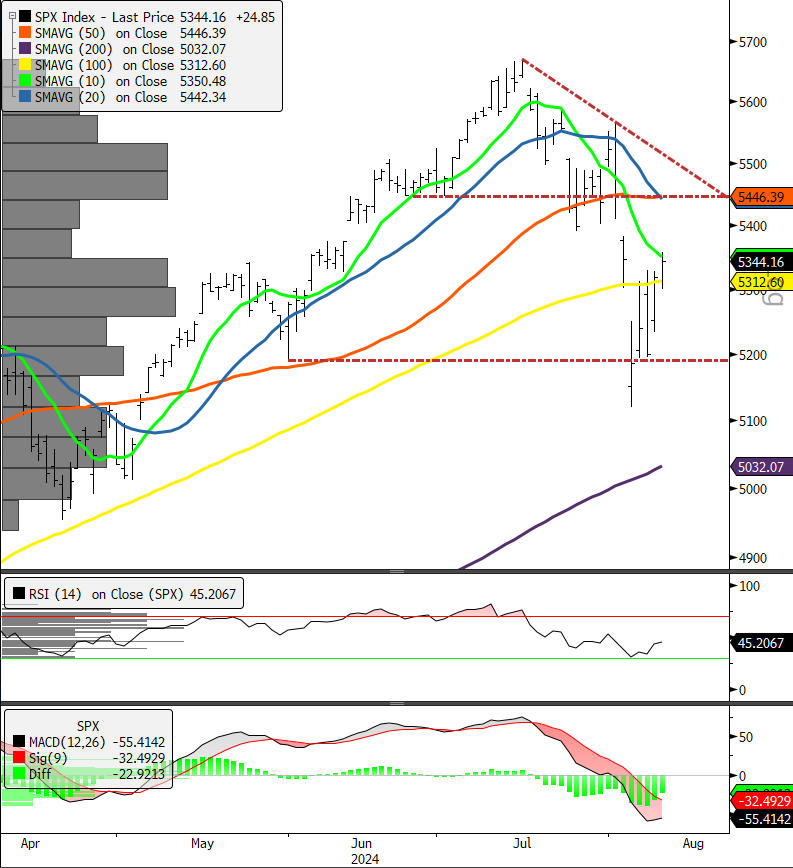
This week we want to take advantage of the present setup in the S&P 500 Index to talk about behavioral dynamics of market corrections and how investors can use price action to get signal from the market itself. The chart below is the S&P 500 from April 10 to present. Note the multiple moving averages (10-day, 20-day, 50-day, 100-day, 200-day) and the grey bars on the left-hand axis. Those bars are a distribution of time at price. They show the most common level for price on the chart. The longest bar is often interpreted by traders as the “point of control” on the chart. When the price is below that point, it should generally be expected to fail at that point. This is because in a negative trend it is a place where shorter-term market participants take profit. A near-term swing trader or a day trader will look for oversold setups below resistance and play for the bounce, looking to sell high into a corresponding overbought level. This is why moving average crossovers are seen as signal and why certain upwards moves on a chart are seen as material to a technician and why others are not.
Given the setup of the S&P 500 heading into August 12, price at 5344 is below the “point of control” on the chart which is between 5426 and 5507 based on our distribution settings. As a tactical signal the Elev8 Model macro equity input would switch long above the 5507 level on a potential bullish reversal for the Index. Below that level we bet with the prevailing intermediate-term correction. We would note however, that the downtrend resistance line becomes an important “tell” of its own if the correction becomes protracted beyond a few weeks and would taper down to generate bullish reversal signals at lower levels.
Last week ended with the Bull trying to proclaim the glass half full, but, given the spike in the VIX, we know the last few weeks have been pretty violent. The only type of investor who didn’t sell last week is a really patient investor or an investor that made a mistake or was out on vacation. You can think about those you know in your own world and decide how many are the former and how many are likely to be the other kind of person. If the second category is bigger, it’s likely there are more folks interested in lightening up on risk in the near-term. So, let’s all do our best to accumulate at oversold points rather than overbought, and we will increase our odds of accumulating the current correction profitably.
–Patrick Torbert, CMT | Chief Strategist, ETFsector.com
ETF’s/The Week in Review
Sectors
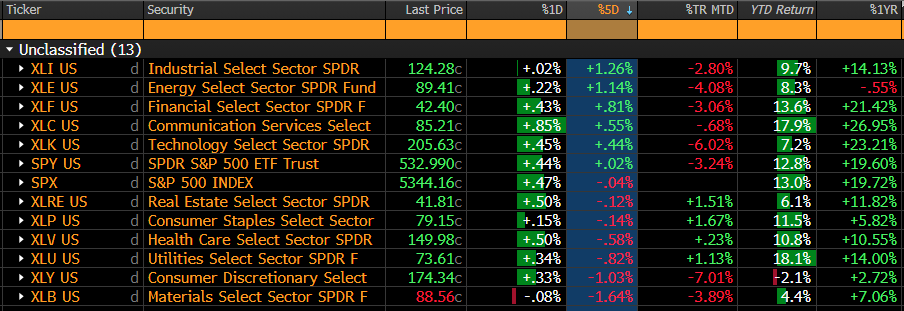
While the prior week was dominated by panic and fear, Investors took time to ponder potential rotation/reflation this week with the benchmark S&P 500 flat on the week. Industrials, Energy and Financials were top performers, but the spread between best and worst was very narrow. The XLK was able to eke out a modest gain after taking a knock, but the buying is still in the confines of a “countertrend” structure at this point.
XLC has established a material bullish reversal from a point of technical weakness at the end of June. The Sector’s construction actually helps it during correction as all the value-oriented legacy Telecom, Media and Advertising stocks in the Sector typically outperform when winners are sold, and that dynamic has been no different since mid-July when equities peaked.
This coming week will offer a chance for the XLK to prove itself, but it will also be a chance for cyclical sectors (XLF, XLE, XLB, XLI) and min vol. sectors (XLV, XLU, XLP, XLRE) to sort out what themes will control the tape. Both have improved with rotation away from XLK and the Mag7 themes.
We remain positioned away from XLK and XLY for now, but we have our eye on NVDA’s next earnings release at the end of the month. That’s the next potential pivot for the Mega Cap. Growth trade.
Did I miss where we solved Global Warming and everything runs on wind and plants now?
If economic growth is right around the corner in the “Soft Landing” scenario, and that scenario is driven by easing interest rates in the second half, why is the Crude chart so lackluster?
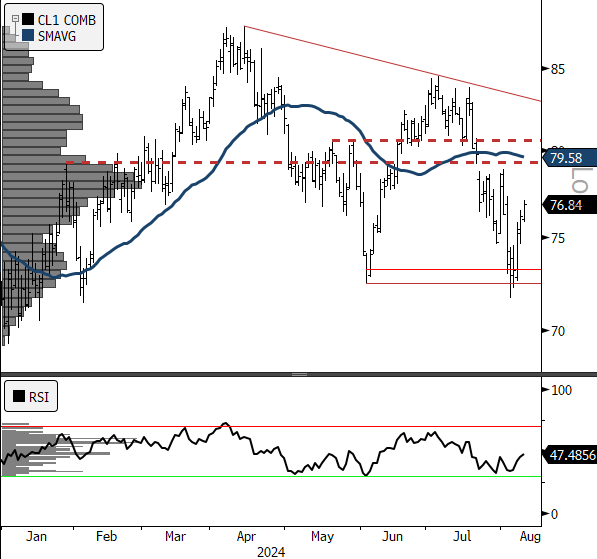
Per the chart below, WTI Crude (CL1) prices retested lows for the year at $71.67 a barrel last week. Prices have now rallied into congestion on the chart. The coming week is a potential pivot for Energy stocks. At present our Elev8 model has a negative score on XLB and XLE due to negative commodities trend and a negative equity trend informing a lower probability of bullish trend change for Commodities prices. As such, we lean towards lower vol. sectors in the near-term. The knife fight, if it comes, is setup to take place at the $79-81 level.
Rates are saying a different version of the same thing
The US 10yr Treasury Yield moved to a new 52-wk low this past week hitting a 3.7-handle for the for the first time since 2023 and then trading up into downtrend channel resistance (see chart below). We would expect the 10yr Yield to be contained by the 4.33% level based on the chart. Another piece of the puzzle that has us giving an edge to min vol. sectors in the near-term.

In Conclusion: We think the Chop will Continue for the Time Being
We learned in July and early August that economic data is clearly deteriorating in the US manufacturing space and starting to bleed into general employment numbers. Weak economic data from here is likely to be seen as a bad thing rather than a good thing and we are looking for the seller to continue being active given bearish price structures across equities, commodities and interest rates. Our least favorite sector at present is XLY because we are highly skeptical that mortgage rates going from 8% to 7% and gas going from $4.50 to $3.50 is the panacea that will save us all. If our central bankers end up finding the punch bowl and providing it to us, that may change, but that is for another week.
Source: Bloomberg