
One more week to go before we close the books on August 2024. Typically a stingy month, this year August started no differently with a 3-day plunge from an open on August 1 of 5537 to an intra-day low on August 3rd of 5119 capping a 9.7% peak to trough decline from the S&P 500’s all-time high in mid-July. The VIX spiked into the 60’s as the ISM Manufacturing report continued to print contractionary readings. Since then, a raft of data including the ISM non-Manufacturing report have come out to ameliorate concern and push prices back up to the cusp of all-time highs with the S&P 500 Index closing Friday near best levels for the month.
While the economy is cooling as inflation prints have signaled, corporate balance sheets have maintained strength, and the Federal Reserve is back in the business of accommodating an expansionary cycle. This has been the tailwind behind equity prices over the last few weeks. We have been pointing to the level of interest rates using the 10yr Yield as a proxy. One reason the rally has persisted off the August 5th low has been the lack of upwards movement in rates (despite the reflation in equity prices) as the chart below shows with the S&P 500 on top and the 10yr Yield on the bottom panel.
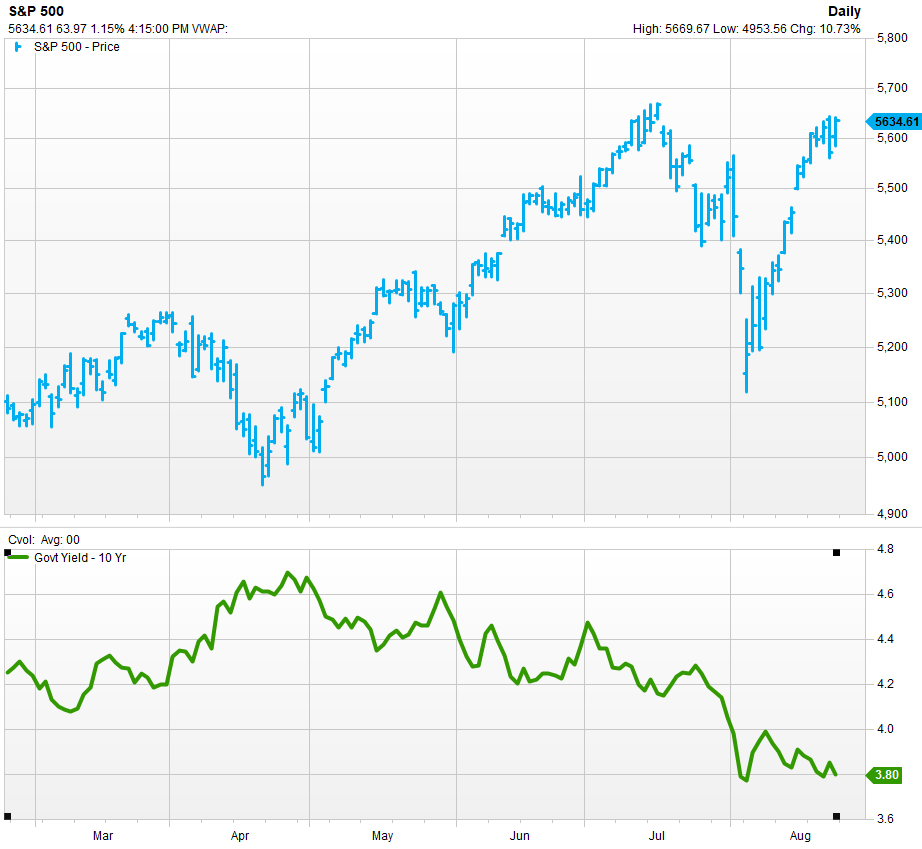
With the 10yr Yield now sporting a 3-handle markets have done much of the Fed’s work for it. The question for the bull is how much lower rates can move. A key threshold to watch will be 3.25-3.4% which acted as resistance when rates were moving higher in 2022 and has been support since 2023 after rates moved above 4% for the first time in the cycle.
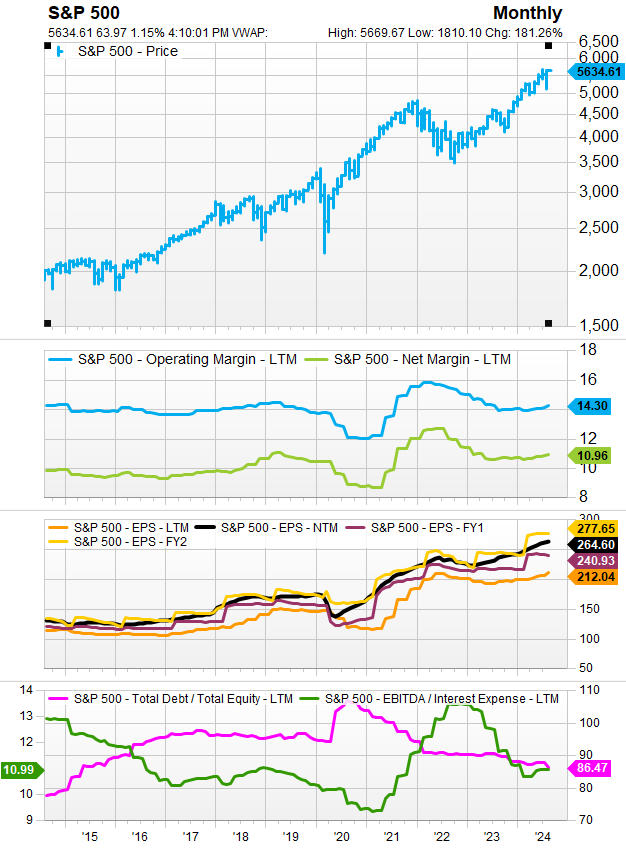
When considering the top-down fundamentals of the S&P 500, we can see why the forward level of interest rates are so important. Referring to the chart below on the S&P 500 and its longer-term fundamental trends, the equity bull has been established upon stabilizing margins that began to turn around in the back half of 2023 (chart, panel 2). Forward guidance is still bullish as FY1 and FY2 earnings estimates remain on a positive trend and the NTM estimates are running almost 25% above today’s. A key driver of for margins has been a reduction in total debt and interest expense on debt. These trends are likely to be challenged sooner than later if investors begin to position for a bullish recovery
–Patrick Torbert, CMT | Chief Strategist, ETFsector.com
ETF’s/The Week in Review
Sectors
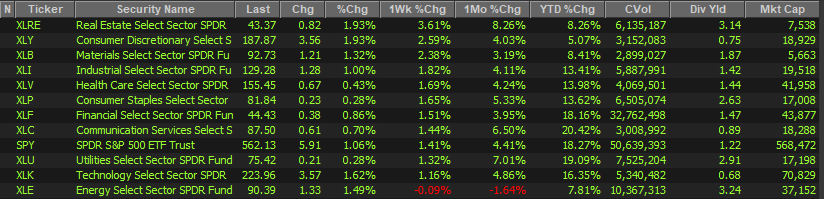
It’s been an interesting week from a sector perspective. XLK and XLY have led performance off the low, but in the past week it’s been YTD laggards that have moved to the front of the pack. Only the XLE has failed to participate from the cohort of worst performing sectors YTD. We continue to see weakness in Commodities prices over multiple timeframes and our model has generally been out of Crude since its inception. We have seen our long signal triggered for XLK, but XLY has fallen just short or our bullish reversal signal for the time being. This has been a detriment to performance in the near term, but the fundamental picture for XLY is not as robust as that of the broad market.
XLY Earnings and Margins
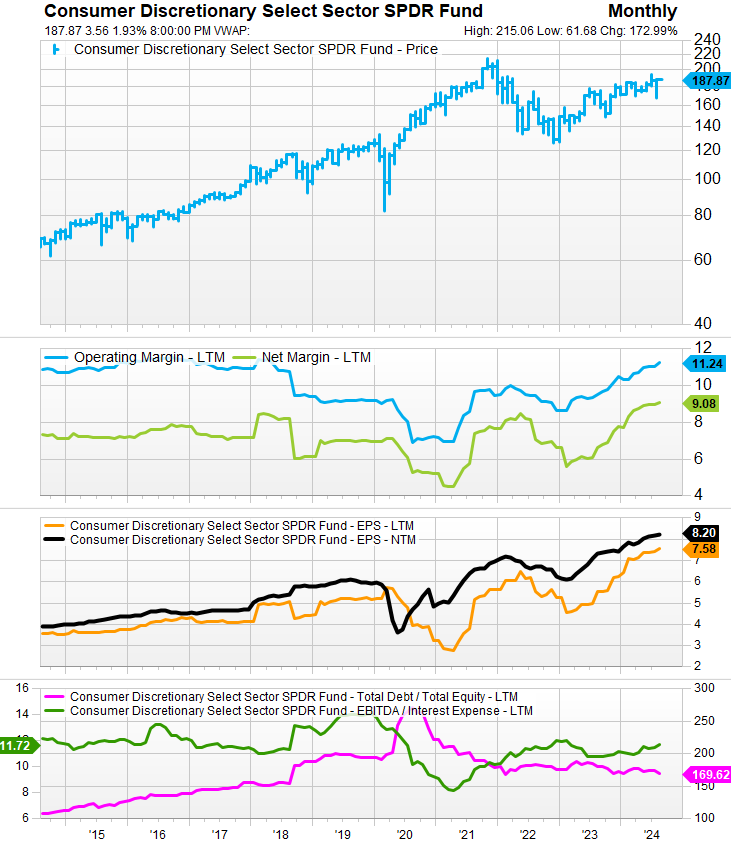
It’s important to note that while the S&P 500 saw margins expand during the pandemic in aggregate, the XLY saw margins contract in the same period between 2019-2021 as the chart below (panel 2) indicates. So, while XLY margins are improving in the near term, they are still retracing progress that was already made and discounted in the past. Further, NTM EPS for the XLY is <10% above the LTM series, while the broad market projects to grow almost twice as fast.
Two of the biggest engines for XLY Growth have been AMZN and TSLA. We still like the former, but the latter is running into trouble both from a technical and fundamental perspective. The TSLA chart below shows actual and projected NTM earnings growth declining over the past 2+ years while margins have also begun to decelerate at best and contract at worst. This deterioration in fundamentals has played out against a backdrop of sequential lower price highs over the longer term. Of all the Mag7 names, TSLA is one that is exhibiting distributional or “toppy” behavior.
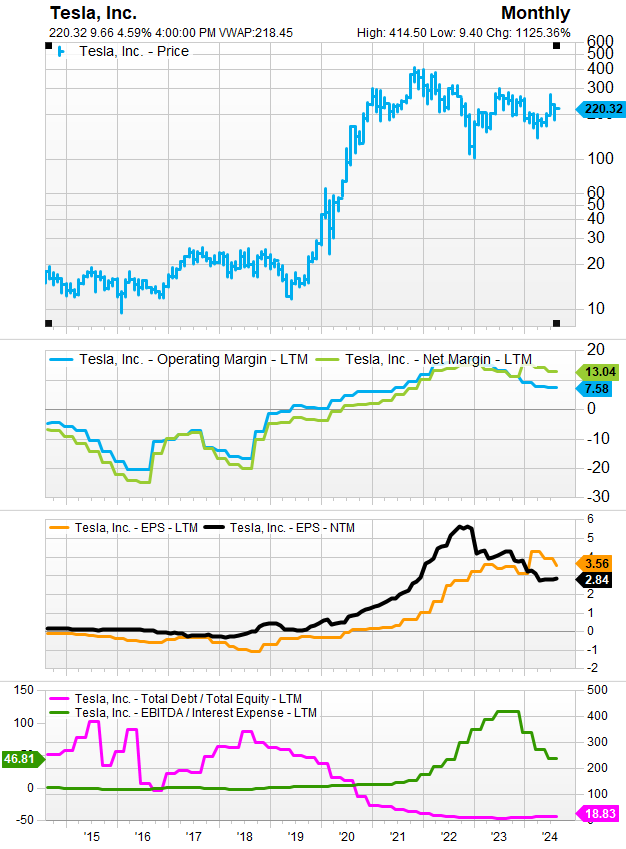
Given the commoditized nature of the automobile industry and the host of new entrants into the EV space, we worry TSLA is turning into a car company.
Tying this back to the level of interest rates, the auto loan market is right behind the housing market as it relates to interest rate sensitivity for consumer spending. We’re all for bull market to continue based on accommodative Fed. policy. That has been a hallmark of the secular bull cycle that has developed since the Global Financial Crisis of 2008/9. However, we will continue to watch interest rates, and we would want them to continue moving lower to make us feel good about re-establishing our long in the XLY.
Source: FactSet Data Systems
