We talked last week about the joys and perils of being a “dip buyer” (Narrations of a Sector ETF Operator | Weekly Market Letter, July 28, 2024 – ETF Sector). This week several data releases came in negative adding some downside juice to the current equity market correction. Most notable, we finally had negative economic data (a contractionary ISM survey) hit the tape as a negative event. Prior releases were seen as a hopeful spur to accommodative central bank policy. Now, even as dovish policy expectations have been established, investors are realizing there could be a more sizeable air pocket between the S&P 500 valuation (Currently >23x according to Bloomberg) and an economy that needs accommodation from the central bank to avoid contraction. We need to consider some of the intermediate-term support levels for equities and Technology shares specified in last week’s note. Lackluster earnings from Alphabet and Amazon have kicked a leg out from the bull market stool for the time being and kicked off a gut check in August.
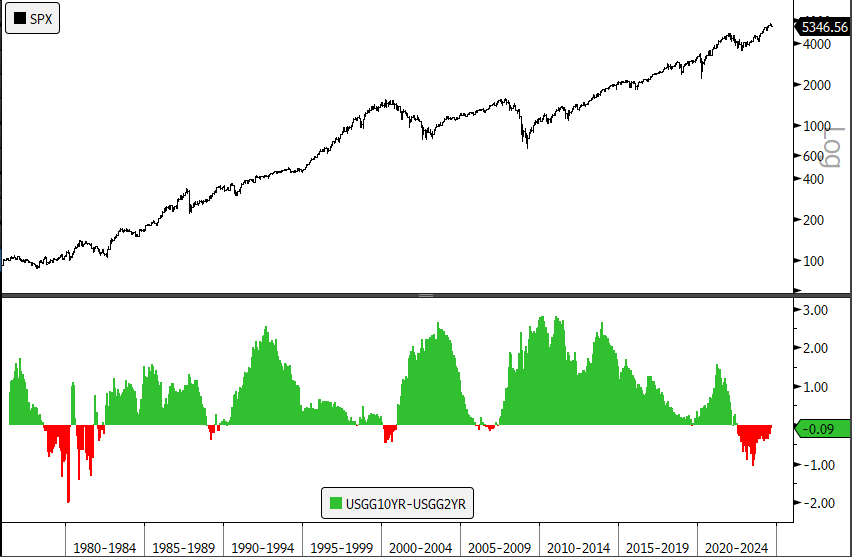
As analysts and strategists start digging into the prospects for economic recovery, a muddy scene awaits them. In our time making business cycle calls for a famous fund family, the research focus was often around business cycle signals from commodities prices and the fixed income market. Historically the table-setter for recession is the first time in the cycle the Yield Curve inverts. However, this bull market, which began in earnest on January 24, 2024, was born against the backdrop of a Yield Curve (as measured by the 10yr-2yr spread) that has been inverted since July of 2022. Long story short, we are not going to have the same signals at our disposal this time around. What we are seeing is the spread of 10yr – 2yr as close to turning positive as it has been since 2022. Historically, equities aren’t typically in the clear until the curve gets close to peak steepness where the 10yr Yield is typically at least 150-200 bps above the 2yr (See chart below). At that point, banks are typically in a strong position to lend. Read on as we’ll look at a few important dynamics that will affect the Consumer and the “Soft Landing” as we go forward.
–Patrick Torbert, CMT | Chief Strategist, ETFsector.com
ETF’s/The Week in Review
Sectors
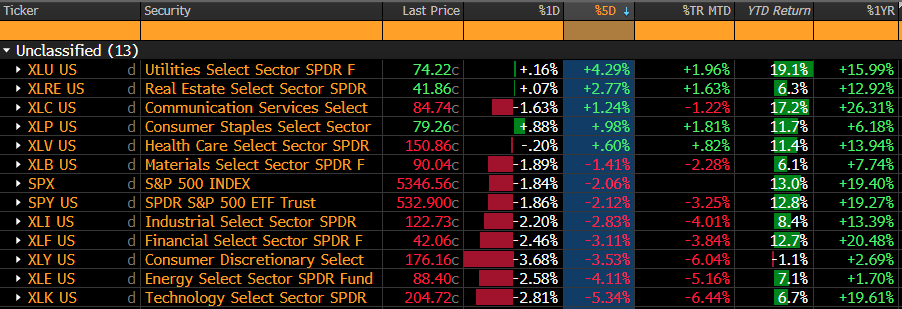
As rates have taken a dive in the near term (chart below) and equities have corrected, lower vol. sectors are outperforming. XLU shares now lead the sectors YTD…quite the bull market! XLC continues to be a steady performer with legacy telecom majors VZ and T offering high dividends.
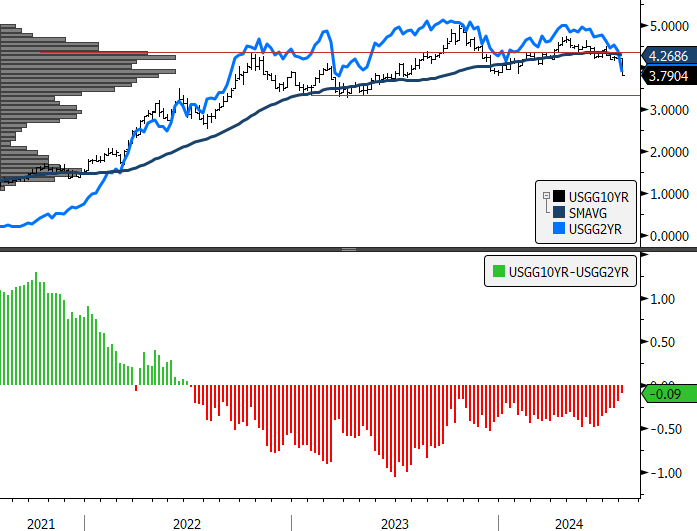
Based on the chart of the 10yr and 2yr Treasury Yields, we think there is potential for more downside to the 3.33% level for rates.
Will Lower Rates be Enough?
Lower rates over a sustained period are one of the potential counterweights to the softening economic data referenced in the open. Lower Yields have already spiked homebuilding stocks higher in the near-term, but from an economic lens, they are a “tax cut” for the consumer and they theoretically will boost home values and wealth effect.
We expect the current correction to ultimately resolve positively into year end, but elevated volatility will likely take some time to shake out. We have shifted into defensive sectors in our model portfolio for 2-weeks until our next re-balance.
XLP an Opportunistic Buy?
During market corrections, we like to look for the most oversold defensive exposure to add. That somewhat dubious honor goes to the XLP among our Sector SPDR instruments. It has lagged the other lower vol. sectors and is a candidate for a “catch-up” rally if investors stay spooked through August. The chart below shows the relative relationships between the XLP and the other historically lower vol. Sector SPDR’s XLU, XLRE and XLV.
XLP has underperformed XLU, XLRE and XLV since April. If there is prolonged rotation into defensive exposures, XLP will look attractive to new entrants.

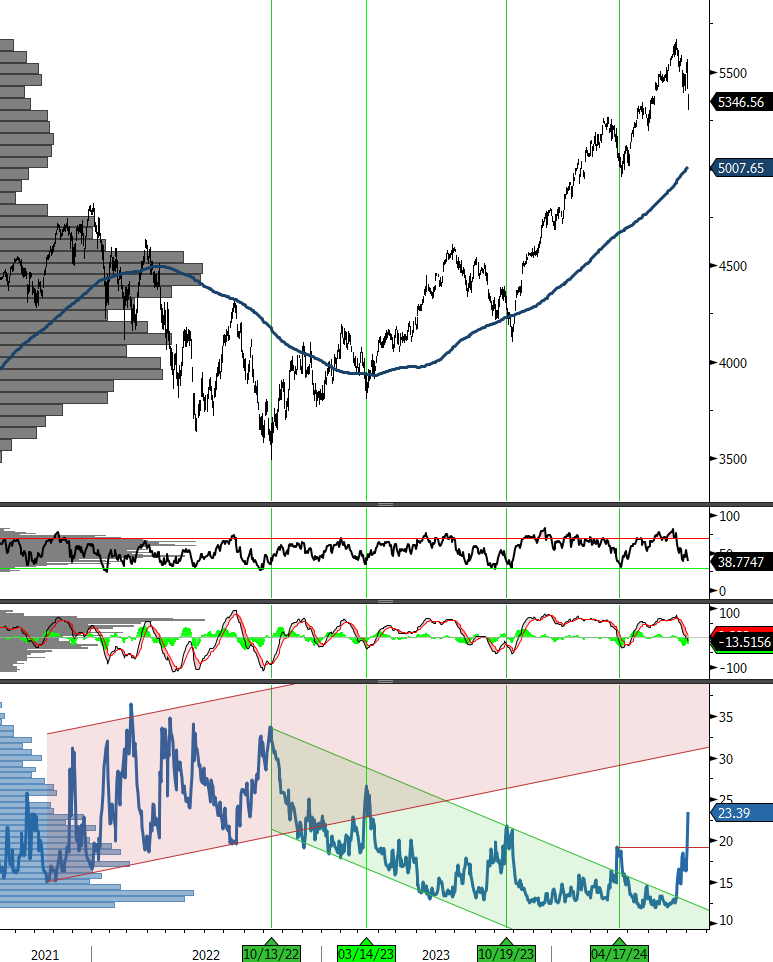
Trend Change for Vol.?
The CBOE Volatility Index (VIX, chart below, bottom panel) has spiked to highs for the year. In the recent past this action from the VIX has been a near-term buy signal for equities, but the current more breaks a benign trend towards lower volatility. Now its highest reading since March of 2023, another manifestation of turbulence as investors weigh policy remedies against a slowing economy.
Energy Prices
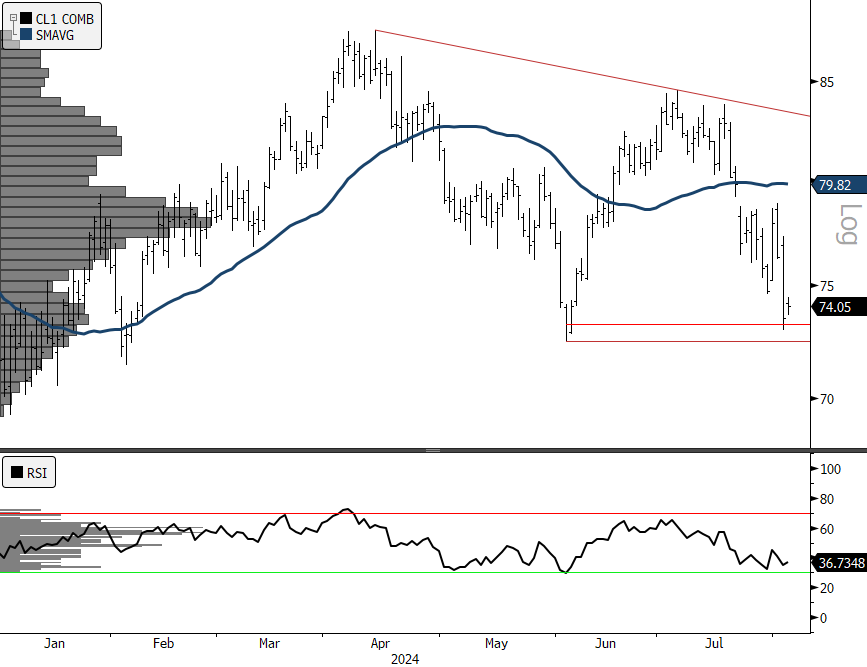
Many opportunities in the equity market come from the misappraisal of positive developments because they are generally slow developing and operate with a lag. We have noted several times this month that Crude prices have been persistently weak in 2024. The longer this continues the more relief we can expect for the consumer. Continued low energy prices and low rates would be welcome and could provide some cost relief moving forward. Keep an eye on the chart! Support is at $72, resistance at $84. A move lower would confirm the downtrend in price.
Source: Bloomberg
