
Narrations of a Sector ETF Operator | Weekly Market Letter, June 23, 2024
I want to talk about time this week. Yes, the ubiquitous kind on which all our lives flow, but also of course the discrete kind, like the humble trading day, or the even more humble day. Depending on perspective and position, time can be parallax (it looks different to each observer based on their different position/perspective). A day is 24 hours for everyone, but as a father of three I see the weight of a day and the perspective brought to bear on a day in multiple every day. My 7-year-old, for instance, is often board and grumpy about it in the middle of the day (usually in a bid to get access to one type of screen or another), but as dinner wraps up, he starts finding the most minute things of great interest with the onset of his bedtime looming. He who has among the most expected days to look forward to in the family is the most loth to surrender his consciousness to sleep. He fights to stay awake to the last and is typically trying to go downstairs in the morning before 5:30AM. His father on the other hand is often sore from chasing him and his younger brother around while being treated like a flesh and blood “Alexa” all day by all three of his children in the absence of the genuine article which is not a member of our household. His father craves bedtime and begrudges his daily alarm clock its job.
A bull or bear market cycle is a similar thing. They have, in hindsight, a great deal to do with time, and in terms of perspective are often seen in parallax due to the varying timeframes that market participants employ to ply their various craft. In my past life as a long-only equity fund analyst, the conversation would be broken down between cyclical and secular bull and bear markets to help our investors position for the short, intermediate and long-term. In the mutual fund industry, long-term was typically implied to mean “around a year or longer”. The short-term was typically “less than 3 months” and the intermediate term was between. For other types of operators those words mean something drastically different, and even among mutual funds there are a wide range of turnover strategies. Still, the conceit of the “investor” is that they partner with companies as shareholders over the long-term, and, as we know looking back at history, being a shareholder of the best companies over the long-term is in fact a great way to make money. The big money question of course is which company and how long is long?
I had mentioned cyclical vs. secular. Secular trends play out in markets over decades or perhaps over each generation. The bull market of the 50’s into the 60’s. The inflationary bear market of the 1970’s, the bull market boom of the 80’s and 90’s that flamed out spectacularly in the Tech Bubble. The lost decade of the 2000-aughts culminating in the disastrous Global Financial Crisis (GFC) of 2008/09. To the present where the monetary and interest rate policy response to the GFC created 15 years of generally rising asset prices against a backdrop of extremely low interest rates. Are we at a point of boredom with Mag7 and AI and “Growth” or are these aspirational companies about to spur promised innovation in the “low tech” side of the market? A wise VC principal mentioned to me recently that companies like WMT are really ground zero for AI. At some point the power and the potential of that technology needs to redound to the user of the application…the end client. If corporations in our consumer facing industries can’t start increasing their share of wealth and profit from leveraging the technology, then what is it really that’s worth so much? And who are the clients that will sustain the growth of the industry? Those questions are too lofty for us at ETFsector, but we do know a thing or two abouts secular markets and when you compare the current one to those of the 1950’s & 60’s and the 1980’s & 90’s, it is apparent that the current secular bull market is far short of its predecessors and could have quite a bit more to go. Don’t take our word for it. See the charts below.
–Patrick Torbert, CMT | Chief Strategist, ETFsector.com
ETF’s/The Week in Review
What’s Hot!
Sectors

The week past offered a rarity. A week where the XLK didn’t lead handily. XLY finally showed a bit of frisk, leading the SPDR’s to with a 1.59% return on the week. Also notable was the fact that 8 of the 11 sectors outperformed the benchmark this week while the also saw 23 new 52-wk highs registered within the S&P 500, this is a welcome expansion of bullish market breadth after 5 straight months of declining new highs for the index. Our biggest concern for the present bull market has been the dwindling upside participation across the GICS sectors as the market appeared to be discounting a broad deterioration in fundamentals of a broad swath of businesses. Now we have the first bullish toehold.
Lower rates have been a catalyst, and they have also been a looked-for salve to the Consumer. So far so good on the tenor of new leadership. We note Utilities are in the bottom. We would expect them to be firmer if the bear was in control. That does not appear to be the case at present!

- S&P 500
- % of Members ABOVE 50-day moving average
- % of Members ABOVE 200-day moving average
- 52-wk new highs | 52-wk new lows
A Digression into Secular Markets
We’d been using this space the past few weeks to delve into the macro drivers behind the Consumer Discretionary, Financial and Industrials Sectors. The data was taking on a subdued if not outright grim trajectory in many cases. We will pause that exercise this week to talk about secular markets as one of the biggest alpha drivers of the next 5 years is likely to be risk appetite relative to the duration of the bull trend in the market. Secular markets are enduring bullish regimes that manifest in bullish (uptrend) price action across multiple business cycles, enduring through recessions despite material drawdowns. We will be taking a look at the last two completed secular bull markets to help us get an “outside view” of our current trend and how long it is possible for it to go.
1950’s-60’s Secular Bull Market
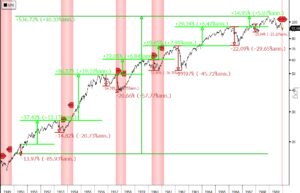
- S&P 500, weekly, January 1st 1949 to December 31st, 1969 with recession shading
- Peak to Peak Expansion denoted in simple return
- Peak to Trough declines > 10%
Measuring price appreciation from January 1, 1950, through the market peak on December 6, 1968 the S&P 500 gained 536% over the18 years. Excluding the recession on the chart in 1949, there were 4 recessions during this secular bull period and there were 8 drawdowns of > -10% if we count only those separated by rallies of >10%. As we mentioned earlier, these secular trends encompass multiple business cycles and potentially whole generations of us as this period was generally synonymous with the ascension of the “baby-boomer” generation. These secular trends are driven foundationally by demographics and the ratio of savers and spenders in society at a given time, but much more as well. The urge to parse causality down a detailed level can be strong, but the insight comes from sticking with the big picture for the moment. Let’s take a look at the next secular bull market.
1980’s and 90’s Secular Bull Market

- S&P 500, weekly, January 1st 18 to December 31st, 2000, with recession shading
- Peak to Peak Expansion denoted in simple return
- Peak to Trough declines > 10%
Measuring from the market high in 1981 (Secular Bull markets start at a new all-time high above the range of the previous secular bear market) through to the peak in early 2000, the most recent completed secular bull market last almost 20 years and returned over 1000% over that time. This bull market manifested longer business cycles and that trend has stayed with us with the average time between recessions increasing. Measuring peak-to-peak advances separated by drawdowns of > -10% we see the bull increased in volatility as its uptrend increased in slope, eventually resulting in the blow-off “Tech Bubble” in 2000. Those that are calling what we have right now with AI and NVDA a bubble would do well to take note of how strong the advance was into the only actual “Tech Bubble” on record. Bubbles are behavioral phenomena born of prolonged optimism that leads to a mixture of exuberance and complacency that results in a saturation of the “it’s different this time” mentality. Take a look at the chart of the current secular bull market advance up next. This is not quite the same scale of prolonged optimism as we had before. That’s the first thing to note.
Current Secular Bull Market 2013-2024

- S&P 500, weekly, January 1st, 2013 to June 23, 2024, with recession shading
- Peak to Peak Expansion denoted in simple return
- Peak to Trough declines > 10%
When comparing the first 11 years of the present secular bull market to the two completed specimens of the most recent past a few items of note stand out. First, equities have advanced 246% since the S&P 500 began this long-term bull cycle by eclipsing its 2007 price high. The secular bull starts at a price high because it marks an era of expansion and speculation. Buying the market below its high is an exercise in at least some level of frugality and value-seeking rather than speculation. Buying below a recent high is buying at a discount and that is a different behavior. So, this bull market has only run up half as much as the 50’s & 60’s bull and only a quarter as much as the 80’s & 90’s bull market. It’s also had its share of large drawdowns in the past 6 years.
The point of this exercise is to focus on the big picture comparison of the current cycle to see if there is really a “bubble” going on. From the 50,000-foot view, this cycle looks like it has room to continue to the upside.
Data: Bloomberg
