It’s been a lovely June just inside the city limits of Boston MA where your narrator resides. Typically, some seasonal skepticism takes over the markets and folks in the region and beyond try to duck losses and the humidity by taking some risk off the table and heading to cooler climbs by ocean beach or lake shore. This summer those plans are on pause as the region cheers on our Boston Celtics as they try to hang an 18th banner and a first one in 16 years. I mention them because anyone who has been following the NBA playoffs closely will have observed an interesting phenomenon playing out around the team.
For those not inclined towards basketball or Boston or both, I will make this brief, the Celtics are a perennial contender, but, heretofore, not a winner. They have talent, but many say they lack grit. They have made it most of the way up the mountain to the NBA championship many times since their two young stars showed up 6 and 7 years ago. This year they have an undeniably talented roster and went 64-18 (7 more wins than the closest competitor). They went through their side of the playoff bracket posting a 12-2 record and most pundits/prognosticators ended up picking their opponents the Dallas Mavericks to beat them in this year’s NBA Finals. The Mavericks, a 50-win outfit, are fronted by All-World point guard Luka Doncic and have established themselves as somewhat of a Cinderella coming out of the West.
This is all well and good, but it speaks to the human being’s reliance on heuristics and tropes vs. actual insight. A popular thought has been to say that since the Maverick’s Doncic is reputed to be the best player in the series, that he will rise up in the typically close games of an NBA Finals and overwhelm the Celtics when it matters most. His #2-man Kyrie Irving is a similar talent as a shot maker, and he will also be hard to stop in these close games. The games will be close because it is the playoffs when everyone tries hard on defense. Dallas has been effective against its competition so far and it has played teams with better records than the Celtics have in the playoffs, and it has won. If you’re nodding (and you didn’t catch game one on Thursday) I totally understand. Those points in isolation are impressive, but they just look back at the bulk of history to make inference rather than looking at what is specifically going on right now.
What was left out of all the general statistical data mining was some very specific information about both teams. Dallas played very well against teams where only a few of the players on the other team were very good outside shooters. The Celtics, despite arguably not having as brilliant an individual player as Luka Doncic feature a top 8 players that qualify as very good outside shooters. Dallas has a great defense, and they won through the Wester Conference playoffs to the finals by packing the paint with their stout big men and forcing teams to shoot outside. The Celtics routinely have 5 players on the court who are positioned behind the 3-point line. Dallas gets many of their baskets on opportunities created by Luka Doncic as he drives to the basket. He lobs to his athletic big men, or he passes out to open shooters when the defense collapses on him. Boston doesn’t collapse on players driving to the basket or leave 3-point shooters. Boston’s center Kristaps Porzingis is 7’3” and is able to protect the rim from a standing position. Now, we will see if Dallas can adjust their game-plan to prevail after a rough start, but anyone considering how each of these two specific teams plays basketball would have known well before the 1st game that the Mavericks were going to be the team with a lot more problems to have to solve than the Celtics.
Why does this matter to you my dear Sector Investor? This month has started with new highs for US equity benchmarks despite some softening economic data. This is understandable to the extent that softening data may keep the Fed. from tightening us into a recession, but it is mildly perverse from the perspective that the data may be showing we are setting the table for a more organic recession anyhow. This blasé attitude to the actual data is a bit cynical, but when looking at how investors have been paid over the longer term it is the most rational thing investors could be doing.
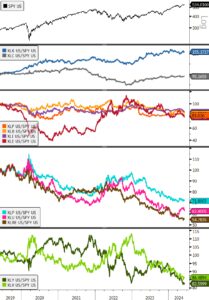
As the chart below shows, there has been only 1 sector that has outperformed the S&P 500 in aggregate over the past 5 years. The only prolonged period over the 5 years where it didn’t outperform, it lost to EVERYTHING else, but while it works there are very few ways to position to beat it. The sector of course is the Tech Sector, represented in our portfolio by XLK. It is the tailwind sector in this secular bull market and the game is figuring out when it ends and when there will be a move away. One thing is for sure, for Tech. to lose its perch as the alpha-sector, another part of the market needs to give us a reason to own. With equity and bond returns having become positively correlated since the advent of Fed tightening in 2021-22, we would expect volatility to pick up if rates remain stubbornly high.
–Patrick Torbert, CMT | Chief Strategist, ETFsector.com
S&P 500 with Sectors Relative to S&P 500 (2019-present, indexed to 100 at start date)

- XLK has outperformed by 55% while no other sector has outperformed in relative terms going back to 2019
ETF’s/The Week in Review
Sectors

Looking at the MTD returns, June has started with a familiar script. XLK and XLC are outperforming the SPY with one other Sector (Healthcare, XLV) joining the leadership cohort in the near-term. Utilities have slumped to start the month after being among the best performing sectors in May, and the commodities adjacent sectors have also remained weak with the Bloomberg Commodities index correcting as May’s soft inflation print was reported mid-month. While that has firmed up consensus around softening inflation and potential for a more dovish policy course from the Fed., what is undeniable from our lead-in chart on longer-term sector performance is that no sectors outside of Tech. have been able to outperform over long periods of time when equities are moving higher. We haven’t seen the “average stock” thriving in this bull cycle despite the large cap. indices registering new highs and rates moving lower. We continue to believe that the Consumer needs help to prolong the bull cycle, in the form of rate relief. We have taken a look at industrials this week and the story looks somewhat similar to Consumer, where rising costs are slowly stagnating production.
Where is the Breadth? Examining the Industrial Sector
The Industrials Sector has shown promise at times throughout this cycle. Construction and Engineering, Building Products, Electrical Equipment stocks, Machinery and Industrial services have all outperformed for sustained periods of time post-pandemic. Generally it has been a sector the investor has wanted to accumulate on weakness and ride higher over an intermediate-term time frame. That is the setup again for the XLI and we have chosen a tactical long allocation in our Elev8 Sector Rotation Model for this month. However, it is undeniable that industrials have been extremely weak over the past month and there is the potential we will not get the expected bounce. What makes it difficult is the prospects of industrials in this cycle (and anything non-Mag7) is that the Mega Cap. Growth theme has crowded out other areas when it has worked, and the sectors without those Mega Cap. growers have only worked during periods of correction for that leadership cohort. In the meantime, breadth for the Large Cap. Industrials has deteriorated with price at a near-term support level. A thrust lower would be a sell signal from this position.

- XLI (200-day m.a. | Relative to S&P 500 | 12, 26, 9 MACD)
- Price is at support with the relative already giving a sell signal. MACD is on the cusp of indicating downtrend vs. consolidation. Price below $120 would tell us to take our long in. Such is the game when trying to “buy low”

- Sector Breadth for XLI is deteriorating as well.
- % of stocks above their 50-day m.a. is an oversold reading at 37%
- % of stocks above their 200-day m.a. is setting up similarly to fall of 2023
- 52-wk new highs are starting to give way to 52-wk new lows
Wy would someone technically oriented bet on this? The answer is that at a portfolio construction level Industrials have the least sensitivity to weak commodities prices vs. XLE and XLB and typically is the only one of those Sectors that outperforms during sustained bull market trends. That said, similar to the consumer the data in absolute terms is weak.
Economic Trends are becoming headwinds for Industrials
With rates staying stubbornly high we are seeing some cracks in the industrial manufacturing and production data. Wages and labor costs have been unrelenting to the upside over the longer cycle and we are seeing inventory accumulation, while we’ve had less manufacturing activity in the consumer sector (automobile production, housing starts) and less $ value of Construction put in place over the last several quarters.
Wages and Labor Cost
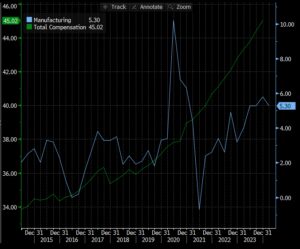
The chart below shows YoY quarterly % wage gains in the manufacturing sector in (blue line) and Total Compensation per hour (green line) for all natural resources, construction and engineering jobs. We can see that the pandemic spurred a <10% YoY cost increase in wages that did not see any proportional mean reversion (3 straight quarters of above average gains in 2020-21 and only one quarter of contraction). Now the YoY measures are back above long-running levels. All the while the total compensation costs per hour have marched steadily higher for all employees. This is not salubrious for margins.

New Orders Stagnating
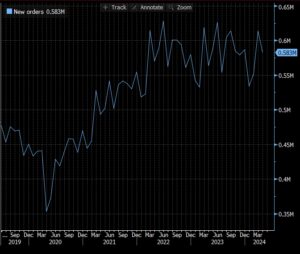
The strong uptrend in Manufacturing: New Orders (chart below) has lost upside momentum and is presently rolling over from the high side of a two-year range. While we can see that new orders moved higher through the bull market of 2020-21, we are not seeing a similar break-out correlating with the latest bull trend from 2023 into 2024. Whether this is organic because money truly is drying up in the system, or whether this is due to poor sentiment driven by the constant inflation narrative, it is a negative divergence to the equity market’s long-term trend and is a fundamental concern for the prospects of the advance.

Capacity Utilization Decreasing
As a likely result of increasing costs and slowing demand we are seeing a longer-term decrease in capacity utilization more broadly since the measure peaked in mid-2022. This has occurred as Construction Put in Place has registered a 2nd negative monthly reading in 2024 (our first since 2022) and Passenger Car production has also dipped to its lowest levels since 2021.

None of these series are in outright contraction like they were in early 2020, but the big picture is one of stagnation and deterioration rather than robust Growth.
Conclusion
As we alluded to in our opening remarks about the NBA playoffs, we are seeing traditional analytical frameworks start to point us towards bearish positioning in many sectors. However, we need to keep in mind the unique characteristics of our adversary when analyzing outcomes and not fall into the trope-based reasoning that elevates conventional wisdom over actual insight. Softness in economic and fundamental data has been a boon to equity prices in this cycle because the US equity market has a herd of Unicorns in its midst at present. These Mega Cap. growers insulate the index from the vagaries of various weak economic data if the rate environment doesn’t completely choke out the consumer and thereby the broader economy. Keep XLK and XLC as cornerstones of the portfolio while the present inflation dynamic remains in force. Interest rates continue to be important and so is the equity trend. While prices move higher, the herd will stay in.
RATES
The US 10yr Yield broke below near-term support last week and also below its 200-day m.a. Since the beginning of the year this has been a time to sell treasuries on a tactical basis, however we note May’s lower high on the yield and we can now draw a longer-term downtrend line off the 2023 peak putting overhead resistance in the neighborhood of 4.7%. This is constructive for equities as lower rates and financing costs would be a boon across several sectors including XLY and XLI that are becoming constrained and could catalyze the continued bull market around enduring strength in XLK and XLC. Given the opponent we are facing, this is what we need to consider!

- US 10yr Yield (200-day m.a.)
- A dip below the 200-day moving average in May confirms the near-term downtrend and sets up a potential test of long-term support below the 4% level
All Data Sourced from Bloomberg
