Narrations of a Sector ETF Operator | Weekly Market Letter, May 20, 2024
This past week started off with some ambiguity as a hot inflation print would have likely re-applied downward pressure to Tech shares and Growth shares more generally. But, as reality transpired, the table is now clearly set for the Bull. Rates have moved lower, and the Fed has the data points it needs to refrain from tightening any further at present.
Now, if you’ll indulge me, I’d like to set the table for this note with an analogy. When looking at the current environment for markets and the tools the sector-oriented investor has his disposal, I like to think of my portfolio positions as players on my football team. And, while fantasy football is ubiquitous and many of us have tried our hands at that, I’m more interested in thinking about the real game with all the considerations for injury, weather, players who struggle to learn the playbook, salary cap. management, players who struggle to live on their own at a young age etc. In other words, all the things that make it structurally difficult to always have the highest ceiling team on the field. That to me starts becoming a very apt analogy for financial markets because the best players in a theoretical framework often are impeded by the less glamorous realities of being a professional in a very demanding industry. Or, for the purpose of our analogy, the best sectors in a bull market are often the ones that perform the worst when difficulties arise and we need to know when to put a different combination on the field to have our best chance when circumstances change.
If I am the Coach/GM that has to both develop the best players over the arc of their careers while also winning enough games to keep my job each season, I need a portfolio of players that can win games in a bunch of different ways. I need to have a long-term approach to the players with the most talent. Those are my long-term momentum winners and multi-baggers. Those stocks have generally come from the Tech Sector and from the Growth style box over the past 10+ years, so there should be some bias towards that cohort when I am stocking up my roster. However, when difficulties arise and the conditions on the field or in the team’s facility are less than ideal, it’s often players with a bit less physical talent and more ability to improvise mentally that help the team win on Sunday. In our current market reality we can think of these players as our Value or Dividend stocks. These players can’t usually outrun the opposition when its players are at peak performance and the field is in top shape, but when the field is muddy and the winds are strong, they leverage their intangibles to get where they need to go more efficiently.
As investors we should all keep this kind of analogy in mind. In the current market cycle, the storm clouds of inflation periodically gather, the referee (The Fed) may start throwing flags and impeding progress, so we should have a few players on the field that can navigate the mud and can deal with adversity. However, at present the sun is out on game-day, and we know that under ideal conditions we want high ceiling talent that can hit the hardest, throw the farthest and run the fastest.
The Field looks fast and the sun is metaphorically shining this week. NVDA is the QB. The fans in the stadium are expecting a touchdown. I think it’s worth buying a ticket.
–Patrick Torbert, CMT | Chief Strategist, ETFsector.com
ETF’s/The Week in Review
What’s Hot!
Sectors
Those who started off May positioned as inflation skeptics are likely sitting pretty MTD. Our recommendations were proven off-sides with the CPI falling short of expectations. We have advised covering shorts in XLK and moving to a long position there, while funding by lightening up exposure to XLE and XLB.
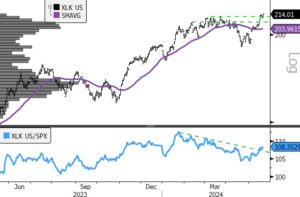
- XLK (200-day m.a. | Relative to S&P 500 )
- XLK has broken out above horizontal resistance on price and downtrend channel resistance on the relative curve. Taken together these are clear buy signals confirming the continuation of the long-term uptrend that began in early 2023

- XLE (200-day m.a. | Relative to S&P 500)
- Not keeping pace with the broad market benchmark. We take our cue’s from the relative curve when the bull market is in force, and XLE’s recent failure at relative trend channel resistance isn’t what we’re looking for
The Technology vs. Natural Resources trade has the most important thematic consideration this year but keep an eye on yields (we discuss them below). Just below the surface we have a decision to make on whether the lack o inflation will spur a main street bull market or if it will be more of a financial asset bull market that we became familiar with the era of zero interest rate policy (ZIRP). This has important implications for the rest of the portfolio. While the table is set for XLK over XLE and XLB, we are interested to see whether investors will continue to prefer bond proxy sectors (XLRE, XLP, XLU) over more cyclical sectors like XLF and XLY. This week should give us a clue as to which way the market will start to bet.
Domestic Sector ETF Flows
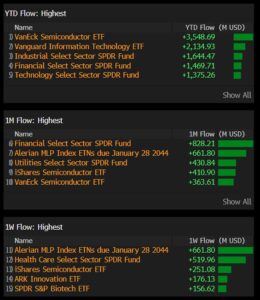
YTD flows show the biggest crowd remains aligned behind the outperformance trends in Technology stocks broadly and Semiconductors more specifically while Financials and Industrials have lagged despite robust flows YTD. Flows in May highlight the near-term preference for Semiconductors exposure which buoys XLK, but also investors positioning for lower yields by adding XLU. In the near-term we are seeing the AMLP ETF and the ARK Innovation ETF attract flows as investors speculate on a near-term bottom in Energy sector shares and trying to get in front of interest in more speculative Growth exposures.
Thematic Equity

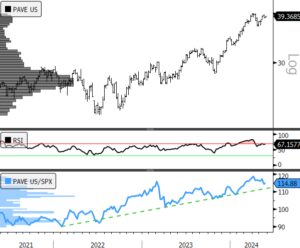
The below table shows the highest YTD, MTD and WTD flows into the 155 Large Cap. ETF’s in Bloomberg’s thematic category. PAVE continues to dominate YTD flows while we’ve seen interest in Small Cap. clean energy, natural resources funds and concept stocks start to attract flows in the near term.
- PAVE (chart below) still looks good but watch the action around the relative uptrend channel support line. A breach below is a warning sign that the party may be ending soon
Domestic Vs. International
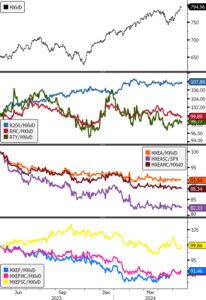
The trade is really US Mega Cap. (Russell 200) vs. everything else. Here’s 12-month relative performance of US (2nd panel), EAFE (3rd panel) and EM (4th panel). Tactically knowing when to bet the field vs. the champ is gold. The correction from late January to late April 2024 offered a chance for ex-US equities to outperform. Follow through has not been impressive and it is hard to make the case for ex-US over US equities as anything more than a tactical idea at present. With US Mega-Cap. stocks poised to regain their footing, it is doubtful there will be a big rotation. However, we are seeing some improvement in the Russell 2000 and in the EM benchmarks. This gives us a sense that investors are using the soft inflation print to add more beta to their portfolios in aggregate and aligns with a continuing bull market.
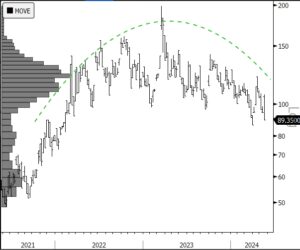
Vol. Oversold in the near-term
Both the VIX and the MOVE indices continue lower in lockstep with equity vol. at a clear intermediate-term support level and bond vol. looking distributional over the longer-term. This set-up is benign for equities, but also borders on complacency. Given the recent break-out in Growth, we’d expect some consolidation here as rates move higher and equities consolidate, but we think this is likely a time to accumulate any near-term weakness given the confirmation in longer-term bullish price structures.
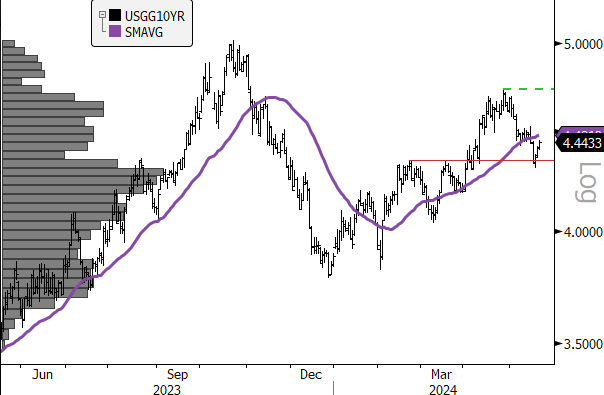
RATES
The US 10yr Yield has bounced off intermediate-term support at 4.32%. We’d expect yields to rally from oversold in the near-term, but eventually continue lower if inflation is indeed contained. The 4.7% level is our key tell that investors see a different scenario unfolding, while a move below 4.32% would confirm the bull for equities in the present context.