
As the dust settles after last week’s presidential election, we want to take stock of our major macro trends and US sector leadership dynamics to make sure we aren’t missing any new messages from the financial markets. Donald Trump’s convincing win over Kamala Harris has been interpreted bullishly by the equity market with the S&P 500 breaking out to new all-time highs on the result. Similar to 2016, there’s a clear perception among market participants that a 2nd Trump administration will be good for business, particularly as it relates to betting on lax enforcement of federal regulations around the EPA and the FTC. While this dynamic is of course bullish in the near-term, it sets the stage for good news to get priced in early which sets up potential for disappointment down the road.
We are taking that setup to heart here at ETFsetor, and we are positioned for more upside into year end. As we can see on the S&P 500 chart, prices are at highs, but we aren’t quite at overbought levels. We expect some FOMO buying into year end and then a pause.
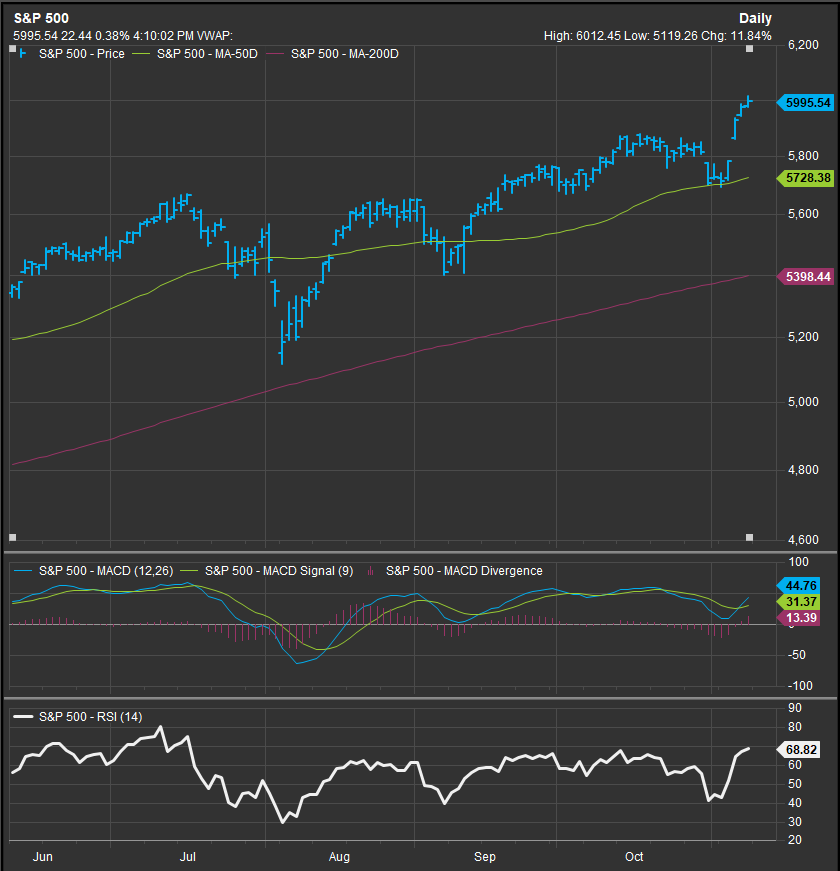
We think that pause likely comes from a re-ignition of the inflation impulse, and we’re seeing early indications from the bond market that too much bullishness in the near-term could trigger rates to move higher when the Fed wants them lower. This could complicate the forward path for the bull market.
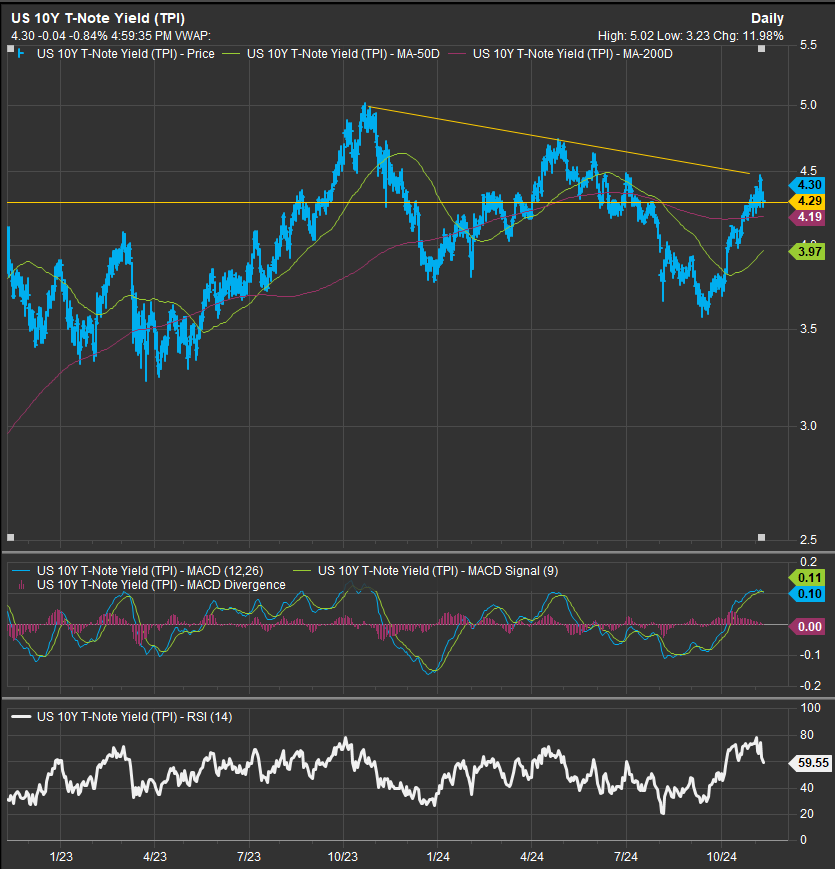
The US 10yr Yield has broken out above resistance at the 4.30% level against our expectations. The next significant horizontal resistance level is 4.50%. As long as the 10yr stays above its 200-day moving average, the near-term chart pattern implies upside continuation. However, the longer-term chart shows downtrend resistance overhead at the 4.50% level.
On thing that caught our attention after the election was the quick run-up in yields despite very tepid price movement from Crude and Commodities prices. We typically think of the two as being closely correlated with investors generally adding commodities exposure when they have conviction that economic growth or inflationary pressures are likely to rise. However, when looking at the relationship between the 10yr Yield and commodities prices we can see that it is out of phase over a 1-month trailing timeframe but is lined up pretty well over a 6-month period, so this move in rates may have been overdue. The two charts below show the change in the 10yr Yield and commodities prices over trailing 1-month and 6-month periods respectively. We can see that the big gap in the 1-month price changes is Yields “catching up” to commodities prices over the 6-month period.

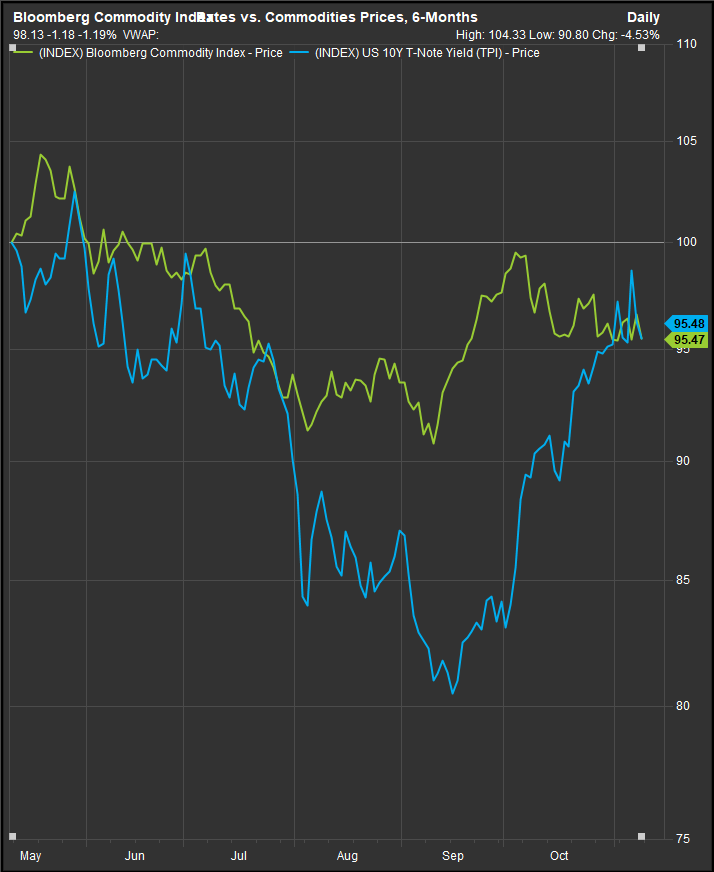
As we’ve thought about the rise in rates as a convergence towards the level of Commodities, we think that sets up a potential pivot moving forward. If rates move lower from here, we will likely see commodities prices and commodities adjacent sectors roll over from here, but if rates stay flat to higher from the 4.3% level, we would be primed for cyclicality and value to potentially take a leadership turn. That would fit in with our philosophical framework for AI, where we’ve posited that a big run-up in Tech. co.’s and other “picks & shovels” plays on the emergent technology would need to eventually hand off leadership to AI implementors who can start benefitting from efficiency in their core operating businesses.
–Patrick Torbert, CMT | Chief Strategist, ETFsector.com
Sector ETF’s/The Week in Review

Unsurprisingly, given the surge in equity prices post-election, offensive exposures like Discretionary, Energy, Industrials, Technology and Financial Sectors led the tape this past week. Consumer Discretionary stocks got a big boost from bullish earnings reports out of AMZN and TSLA at the end of October. The Energy Sector gains were notable because they were not catalyzed by rising Crude prices. This leads us to believe that bullish sentiment is driving a rerate of assets across the risk spectrum to align with a re-emerging bull market consensus.
Bottom performers for the past week were historically lower vol. sector exposures Staples, Utilities, Real Estate and Healthcare along with the Materials sector. The former sectors are historically challenged on performance during bull trends, but the Materials sector inclusion on the list is somewhat surprising given the stronger performance of other high beta sectors. Given weak commodities prices, we continue to be underweight materials, though we have gone from short to long with our Energy sector bet given Trump’s win and the Republican control of congress, we expect regulatory roll-back to provide an impetus for speculation in Energy shares.
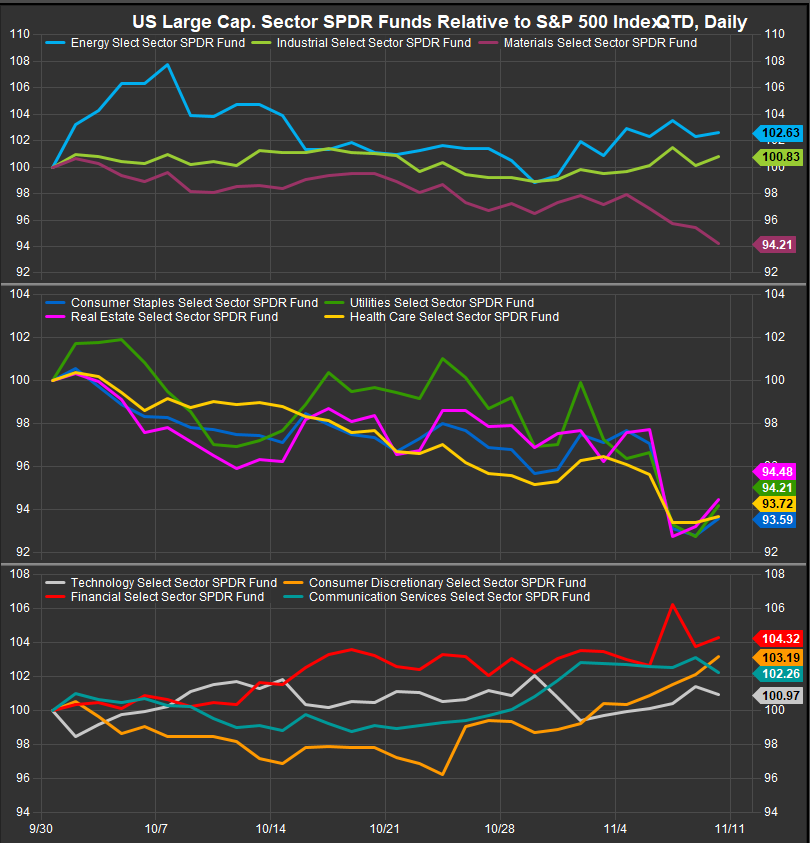
When we look at the 11 GICS Sectors and their performance relative to the S&P 500 (chart below) since the end of September, we can see the risk-on tone QTD. The setup again highlights rates as a potential pivot. If the 10yr stays high, we expect low vol. sectors (panel 2) to stay in a performance downtrend. If rates retreat with no upside follow through from Commodities prices, we could see low vol. sectors rallying from here.
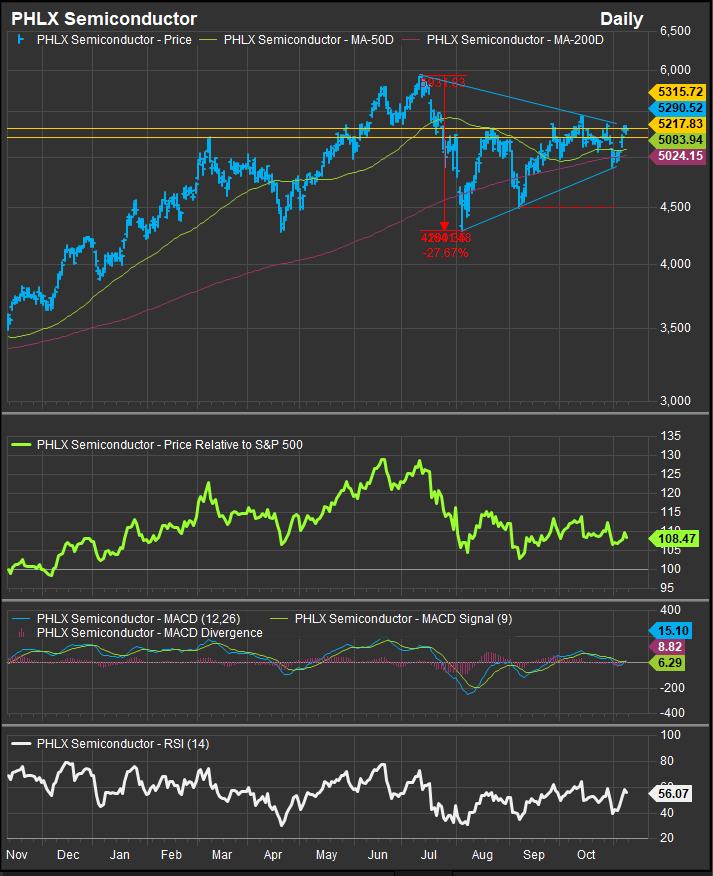
Semiconductors Remain at a Pivot Point
The Philadelphia Semiconductors (SOX) Index remains in consolidation and short of a clear bullish reversal based on its near-term price action. An examination of the price chart YTD shows a potential distributional (topping) pattern has formed in the index from March through September. Price has rallied up to resistance but hasn’t broken out in a decisive way that confirms bullish reversal. We also haven’t seen a higher high on the relative curve since early October despite the short-term rally in prices. The Sox Index is a key gage for us, as we generally expect Technology shares to move higher with the broad market, but we’ve seen the Software Industry in aggregate roll over, and if Semiconductors fail here too, we will take that as a signal to go tactically underweight the Tech sector.
Russell 2000 Attracting a Post Election Bid
Price action in Russell 2000 stocks has been bullish since the election with prices gapping higher through near-term resistance. We assume a Trump presidency invites speculation of increased M&A activity as his previous administration took a lax view on anti-trust issues and was generally pro-business in its ideology. As we mentioned in our post-election day recap, Small Cap’s would benefit from and M&A roll-up dynamic.
From a technical perspective a move in the relative strength curve above the 107 level (chart below, panel 2) would confirm the Small Cap. bullish reversal vs. the S&P 500 and would imply more sustained outperformance from smaller co.’s

Conclusion
Interest Rates, the Sox Index, and Small Caps are our key pivots to watch this week for leadership cue’s moving forward. Semiconductors are vulnerable based on the tehcnicals, Small Cap’s have potential tailwind, and rising rates would likely be a boon to Value over Growth. So far, we haven’t reached that tipping point, but that’s where our attention is focused this week.
Data sourced from Factset Research Systems Inc.
