
The S&P 500 is pulling back from its recent all-time high and sits 2% above its near-term support zone. The price gap on the 6-month daily chart below is expected to be filled, which also coincides with our expected support zone for the S&P 500 at the 5763 level. In ideal circumstances, we are approaching an accumulation zone for equities in the context of the longer-term bullish trend.
However, what’s on our mind this week is the back up in interest rates. We see rising rates as a potential fly in the ointment for the bull moving forward. Macro events have been lining up behind the bullish narrative for equities in 2024, but dovish Fed policy followed by Donald Trump re-taking the Whitehouse in the recent US Presidential Election has sparked exuberance. Now we are seeing investors move up the risk curve to capitalize.

The result is we are seeing rates move higher in contrast to the Fed’s preferred outcome. If market dynamics continue to hinder the Fed’s policy goals the path to a sustained bull market trend gets harder to actualize. Lower rates were seen as a potential tailwind for a reinvigorated consumer, a key to unlocking the housing market and a way to lower capital spending costs in the Industrial and the Real Estate Sectors. Needless to say, if rates continue to move higher, we will be approaching interest rate levels last seen in the spring when inflation was top of mind. We are skeptical the good times will continue if US rates approach 5% again. We will be looking today at the state of the economy in our note and whether what we see supports the re-emergence of inflation or not.
Patrick Torbert, Editor & Chief Strategist, ETFSector.com
Week in Review: Sectors
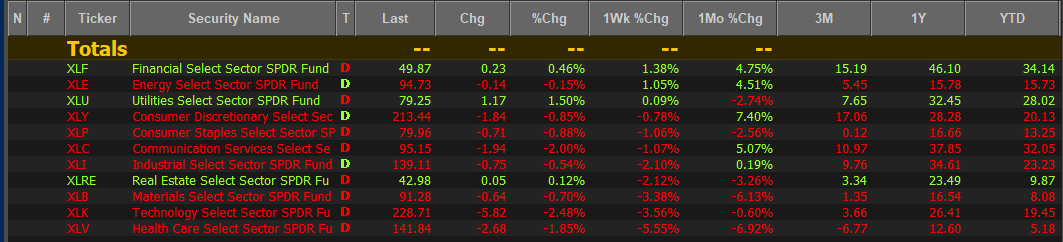
As the S&P 500 retraces post-election gains, sector leadership themes have been somewhat directionless. The leadership mix for the week was reflective of this as Financials, Energy and Utilities led the tape among GICS Sectors. Energy stocks have seen prices firm near-term despite tepid crude oil prices. Utilities are bouncing from oversold conditions in the wake of the election. Financials are YTD leadership as the bull market trend matures. Our sector model inputs still favor a continuing bull trend and we are presently long Financials, Discretionary, and Comm. Services as our top 3 overweight positions. We also are long Energy, Industrials and Technology sector positions, though we have been reducing exposure to Tech. as the uptrend there is losing momentum which is often a pre-cursor to trend change.
What’s Driving Rates Higher?
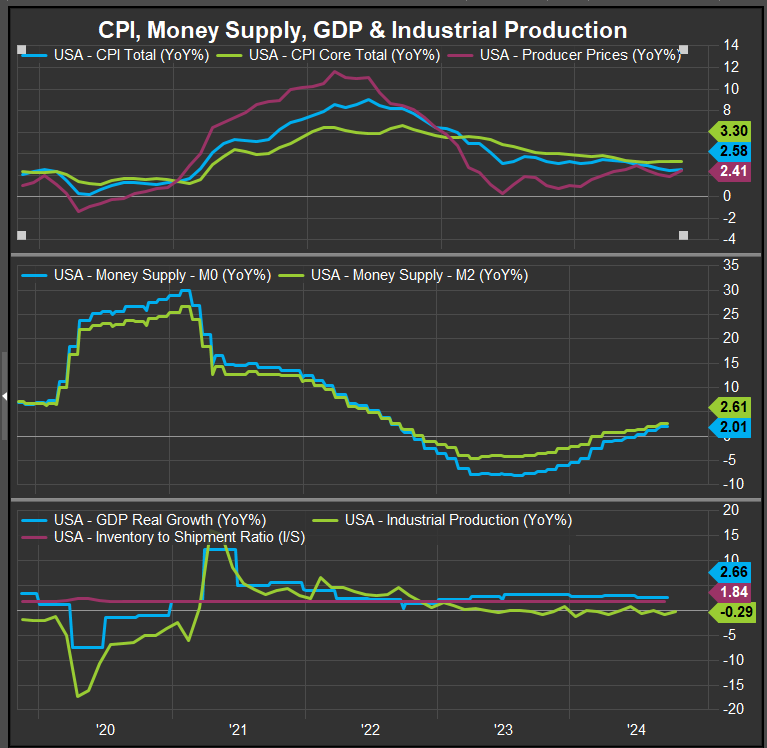
While we typically rely on technical inputs to keep us in the strongest trends and away from the weakest, we also keep tabs on the macro-economic picture to make sure equity markets reflect a coherent perception of the available data. The chart below shows the inflation data series, money supply and inventory measures over the past 5 years. This period encompasses the run-up to 2022’s inflation spike and its aftermath. What was clear then was a big build up in M1 and M2 money supply AND industrial production measures ahead of the inflation surge in 2022. When GDP growth spiked as well in mid-2021 against the backdrop of policy rates still on a zero-handle, the macro setup was primed for inflation. Looking at these same data series now, we are not close to the same setup. Money supply measures have just crossed back over into positive readings. Industrial production has flat lined, the inventory/shipment ratio hasn’t budged, and GDP growth remains below 3% year over year. These are not the factors that have rates rising in our opinion.
Unemployment Remains Low, Misery has been receding over the past 2 years.
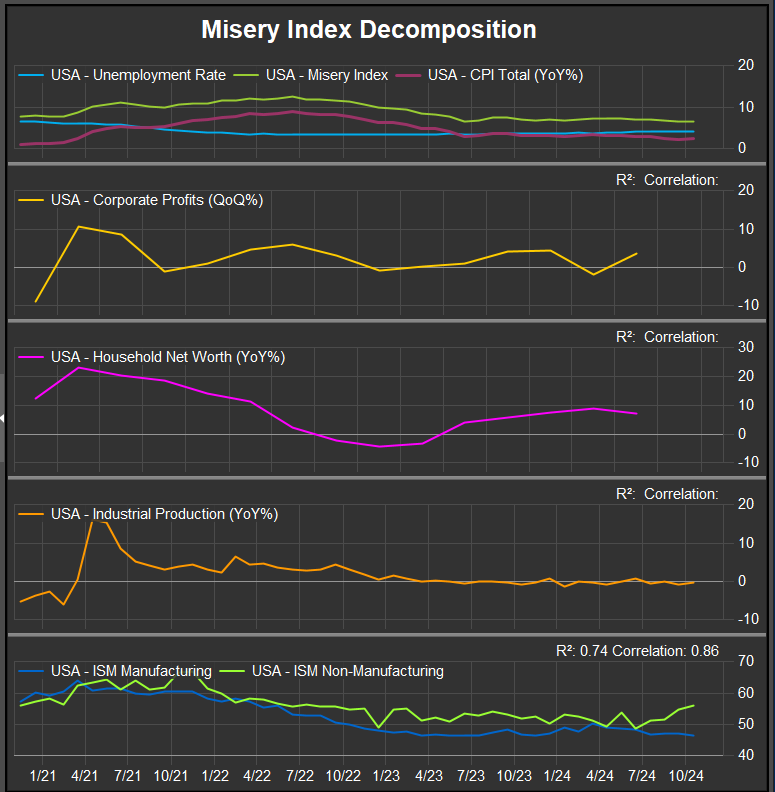
Our next chart (below) looks at the Misery Index which is unemployment + CPI. Typically, a high misery index is trouble for the US economy, but that measure has been moving in a positive direction (lower) in 2023-24 with the CPI moving lower on its most recent readings. In the middle panels of the chart, we see aggregate corporate profit margins in the US along with US Household net worth. These series are posted quarterly and will be a key piece to the puddle. The last readings were constructive for the continued bull market, but if margins and household balance sheets come under pressure, we could see that as an impetus for equity consolidation.
Commodities Prices are Diverging Negatively from Rates
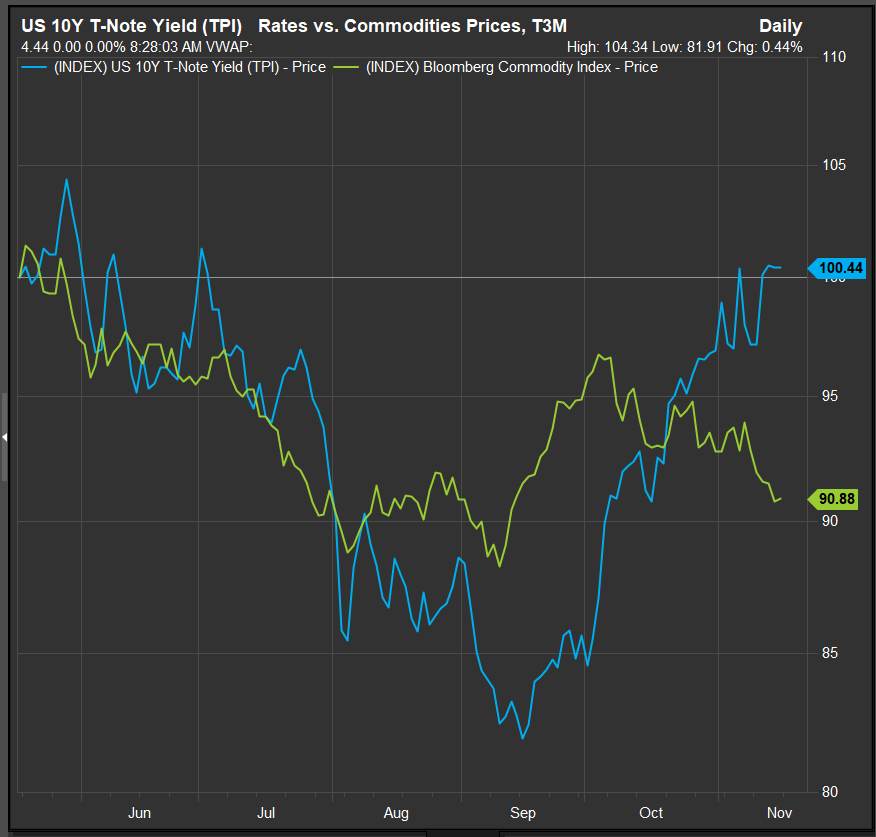
What’s been most curious to us as rates have gone higher is that Commodities prices have done the opposite. This has kept us betting against a continued rise. The US 10yr Yield is now back where it was in May while the Bloomberg Commodities index is off 10% over the same time period. So far, this is not the stuff of sustained inflationary shocks.
We would be Concerned if Yields eclipsed the Policy Rate to the Upside
Our last chart this week shows the US time denominated Treasury Yields vs. the Fed’s policy rate. Since guidance was issued for cuts in the second half of this year, yields have moved lower. Now they’re backing up as the Fed has continued its easing program. Regardless of the technical support levels, the 4.75% level of the policy rate will be key to watch. We think the probability of a significant correction/retracement would rise significantly if yields cross above the policy rate threshold.

Conclusion
Despite the long-term bull trend that has moved the S&P 500 to one of its best YTD performances since its inception back in 1926, rising rates are a concern. In our note this week we looked at CPI, money supply, industrial production and commodities prices and found that none of these data series are showing readings similar to 2021-2022 when the CPI surged higher and triggered a bear market with a 28% peak to trough drawdown. “The Trend is Your Friend” is a technical analysis proverb that serves investors well in times of uncertainty, and the trend for equities has undeniably been an uptrend in 2024. We remain vigilant for reasons to lower the risk profile of our own portfoiio, but while rates have moved higher, none of our indicators that would support a continued move higher have triggered.
Data sourced from Factset Research Systems Inc.
