
September nears its conclusion as a strong month for US equities which saw the S&P 500 confirm its uptrend with a new all-time high. This achievement was spurred by Fed policy as the FOMC enacted a 50bp cute to the Fed Funds target rate and guided for a further 50bp reduction into year-end. This has come as inflation prints have continued to cool and commodities prices have stayed low over the past 6-months.
At an S&P 500 all-time high with a dovish Fed, a stimulating PBOC (People’s Bank of China) and a US economy near full employment, the outlook is necessarily bullish. At ETFSector.com, our trend following approach to adding alpha in our portfolios has us positioned for the bull market to continue. See our Elev8 Sector Rotation Portfolio positioning for October here. However, we do like to explore where we can be wrong. This week’s letter looks at weak Crude and Commodities prices along with the downtrend in yields to identify technical levels of significance for trend change.
From a big picture perspective, we are now at crossroads for the macro narrative. If we view the Fed as delivering on consensus expectations for a soft landing, we now must look to the financial markets to discount a more bullish future. Leading into the interest rate policy announcement in mid-September, investors were buying bonds as ISM manufacturing data was coming in at a contractionary reading in the 40’s. The 10yr Yield which was near 4.8% in April has moved lower by 100bps. Investors have also been buying stocks as the Fed is perceived to be in a dovish stance with a focus on firming up the economy for Main Street. The key question is when investors will begin to embrace an economic expansion scenario by positioning for higher demand. That would seem to suggest a shift towards industrial and commodities plays at some point.
Our technical process still sees clear weakness in Crude prices, but Commodities broadly have perked up in the near-term. What happens from here for Commodities prices will likely be important for determining leadership. Read on as we look at longer term trends in commodities prices to furnish you with some key indicators for equity sector leadership moving forward.
–Patrick Torbert, CMT | Chief Strategist, ETFsector.com
Sector ETF’s/The Week in Review
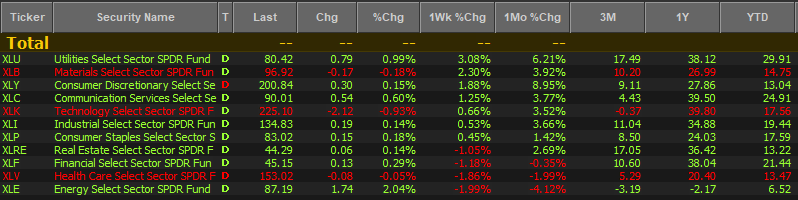
Odd bedfellows XLU and XLB were leadership for the week concluding September 29th. Utilities stands out as the best performing sector over multiple timeframes, 3M and YTD, while it is now close to matching performance of XLC and XLK over the trailing 12-months.
On the one hand, XLU has had a tailwind from falling interest rates since April of 2024, but on the other hand it is surprising that regulated Utilities have been the best performing sector in a bull market that is more than a year old. This leads us to the conclusion that Utilities are in a reflation period given steep underperformance over longer-term timeframes (3yr, 5yr, 10yr) and they are benefitting from that in the near-term with catalysts from falling rates and uncertainty over the strength of the US economy. Our trend following sector rotation model hasn’t registered enough positive inputs to flip our view on Commodities and Interest Rate trends from down to up yet, but it is something we are watching closely because it is a risk not only to Utilities Sector outperformance, but our positioning more broadly which is anticipating a deflationary/bullish setup for equities moving forward.
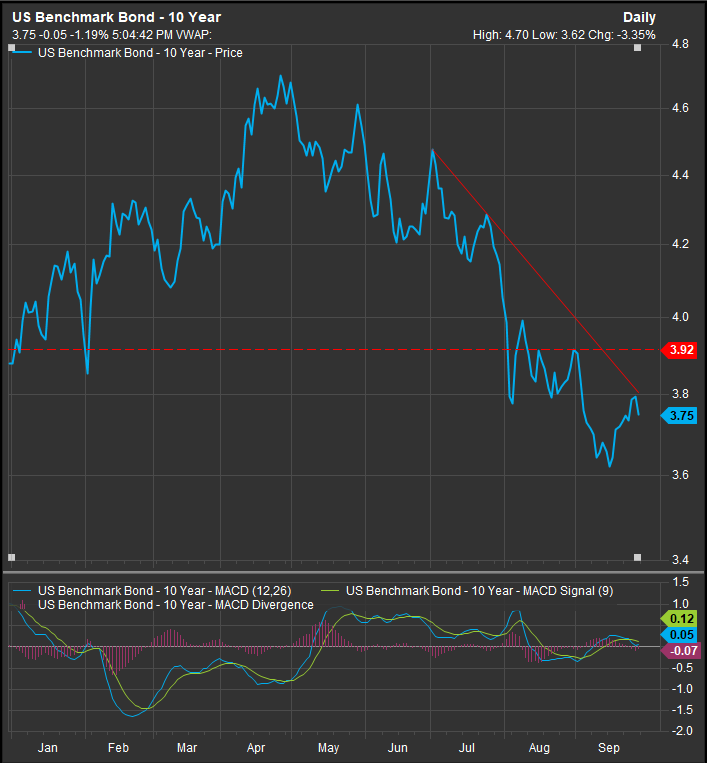
Rates have Rallied into Resistance in the Near-term
The chart below shows the US 10yr yield YTD. The downtrend channel drawn on the chart gets violated to the upside above 3.80%, but overhead resistance is more substantial between 3.92-4%. We think that is a key level to watch for 10yr rates moving forward. Above the 4% level we would expect some selling in the Mega Cap. Growth cohort which would likely impact XLK, XLC and XLY performance in a negative way if it were to play out.
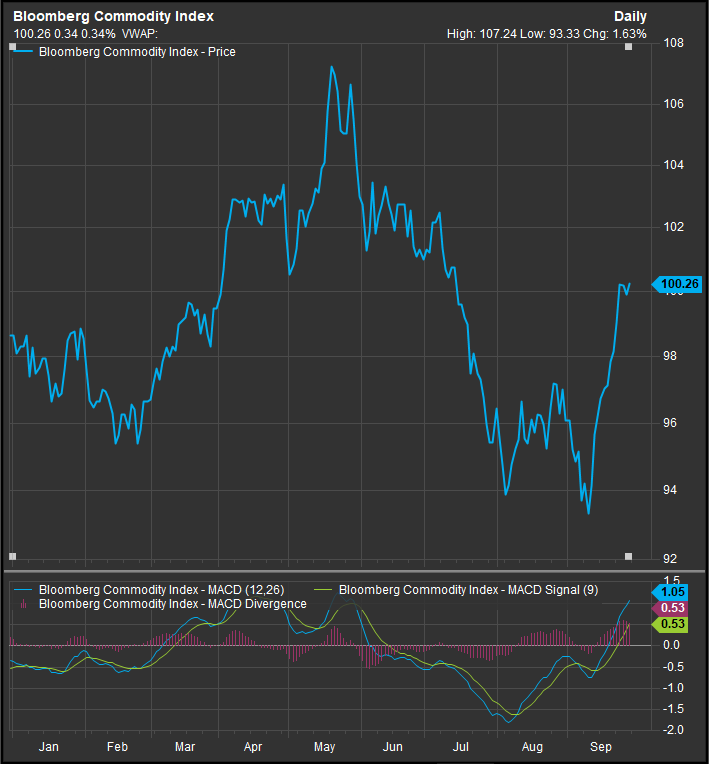
Commodities Prices Surging Near-term
The Bloomberg Commodities Index (YTD price chart below) has rallied from an oversold level at 94 to the 100 level. We have gone long the XLB to cover some of our portfolio level short to commodities exposure as a response to this nascent bullish reversal. Our MACD momentum gage has shown a strong buy signal and near-term bullish trend change for the index.
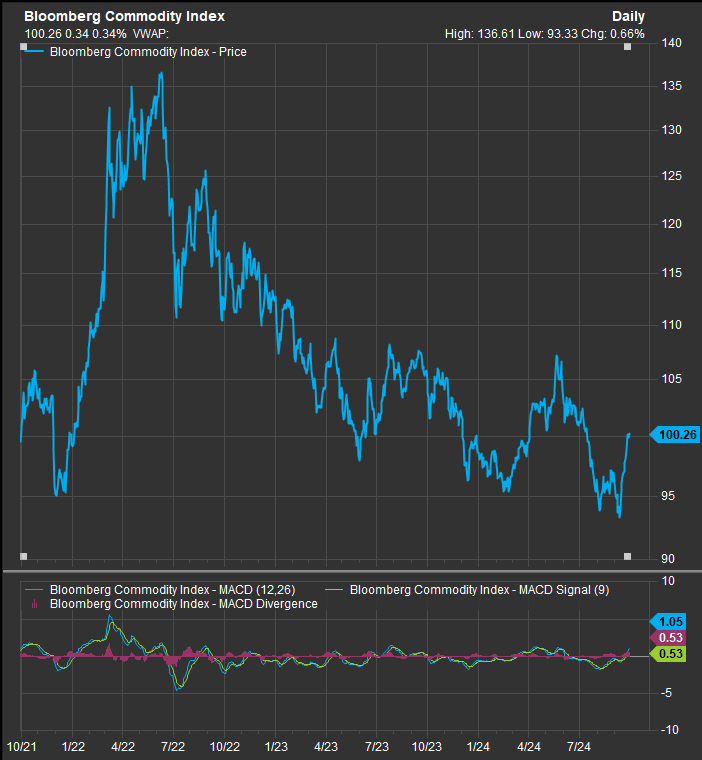
However, our approach is about aligning with the strongest longer-term trends and the 3year chart of commodities prices (below) is still firmly in downtrend territory. It would need a move above the longer-term congestion zone to change trend. The important level on the chart is 107.
Crude Prices Remain Weak Relative to Commodities Broadly
Crude prices have not manifested any bullish behavior in the near-term despite some signs of exuberance for commodities generally. Both made YTD lows in September, but, while the BCOM Index rebounded to a near-term higher-high on price, Crude remains in a clear downtrend without indications of bullish reversal. $72 is a minimum threshold to show some positive signs of technical improvement on the Crude chart.

Trend change over a longer-term time horizon for the Crude chart would involve a move above the 2yr congestion zone between $68 and 80 (3yr WTI chart below). The most likely upside scenario would be a retest of the top of that longer-term range on speculation of strong economic stimulus. We would likely be forced to cover our XLE short in that scenario. The only hopeful ingredient in place right now is price resting on longer-term support, but even that potentially bullish plank is undercut by the new low made in September which confirms the price downtrend for Crude

Source: FactSet Data Systems
