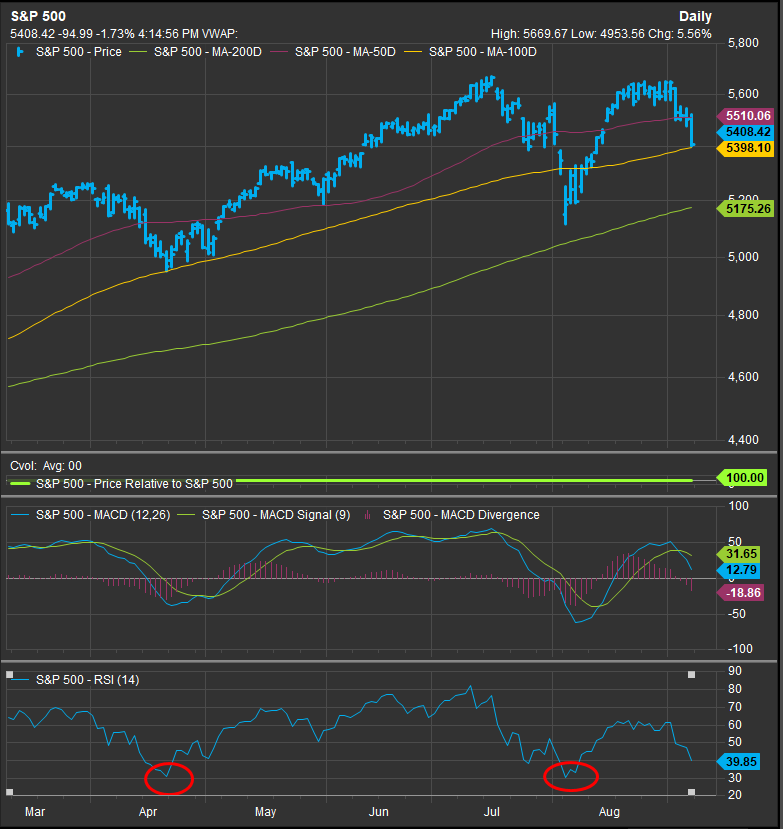
Equities got the proverbial “flop” at the beginning of September, and it was decidedly bearish. The S&P 500 Index is off > 5% to start the month and sits near oversold levels on the daily chart.
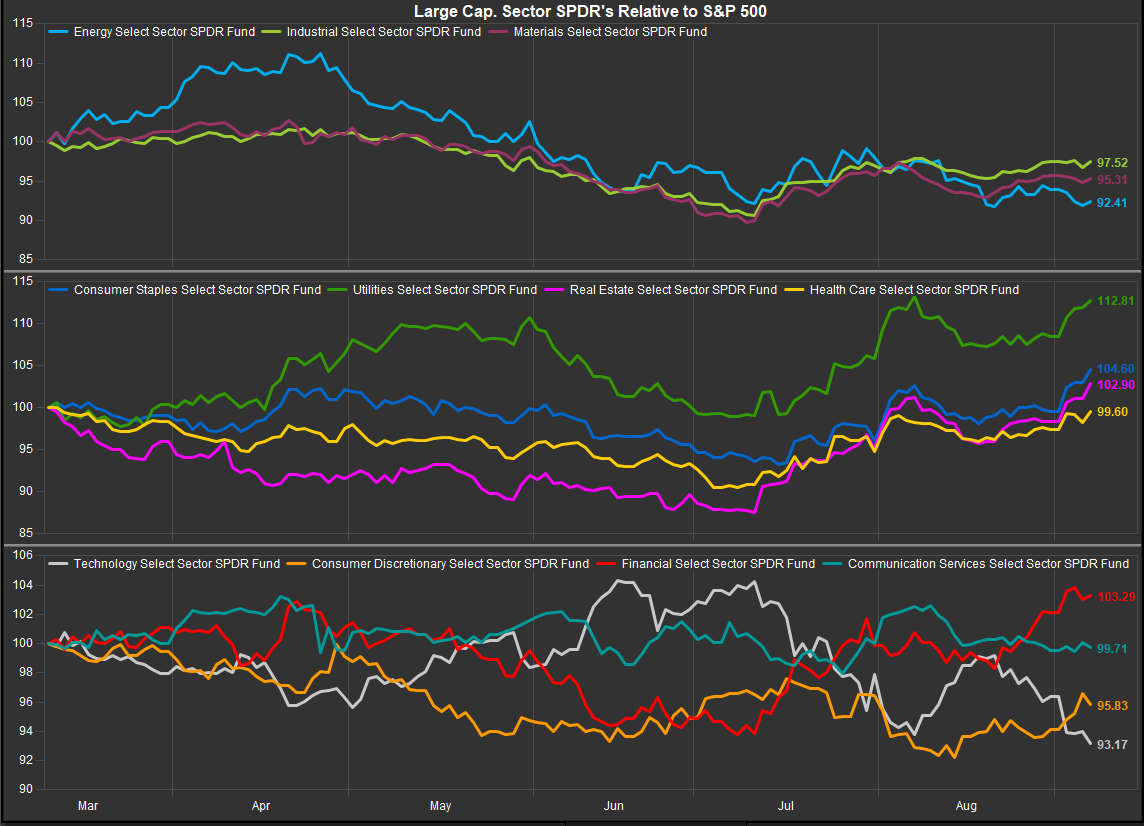
Sector performance has confirmed a “risk-off” tone to the tape. Sectors with historically lower vol., higher income generating profiles like XLU, XLP, XLRE and XLV have led along with somewhat odd bedfellow XLF since equities have peaked in mid-July. That combination of leadership has been interesting, but, in hindsight perhaps not surprising. XLF had been a big laggard in 2023, a year which started with bank runs and rapid escalation in interest rates. As benchmark yields move lower in synchrony with the growing consensus on dovish Fed. policy in the 2nd half, Bank balance sheets have been getting repaired and are adding value on a mark-to-market basis.
XLK shares have become a victim of their own success with NVDA giving investors pause by simply exceeding but not obliterating their recent quarterly expectations. XLC has underperformed as well as Mag7 and other YTD winners like LLY and AVGO are being redeemed in the near-term as investors take profit and de-risk. After all, policy easing happens because data is weakening. ISM reports continue to print contractionary readings below the 50 level. Any softening in employment data would start to paint a less than salubrious picture for the economy.
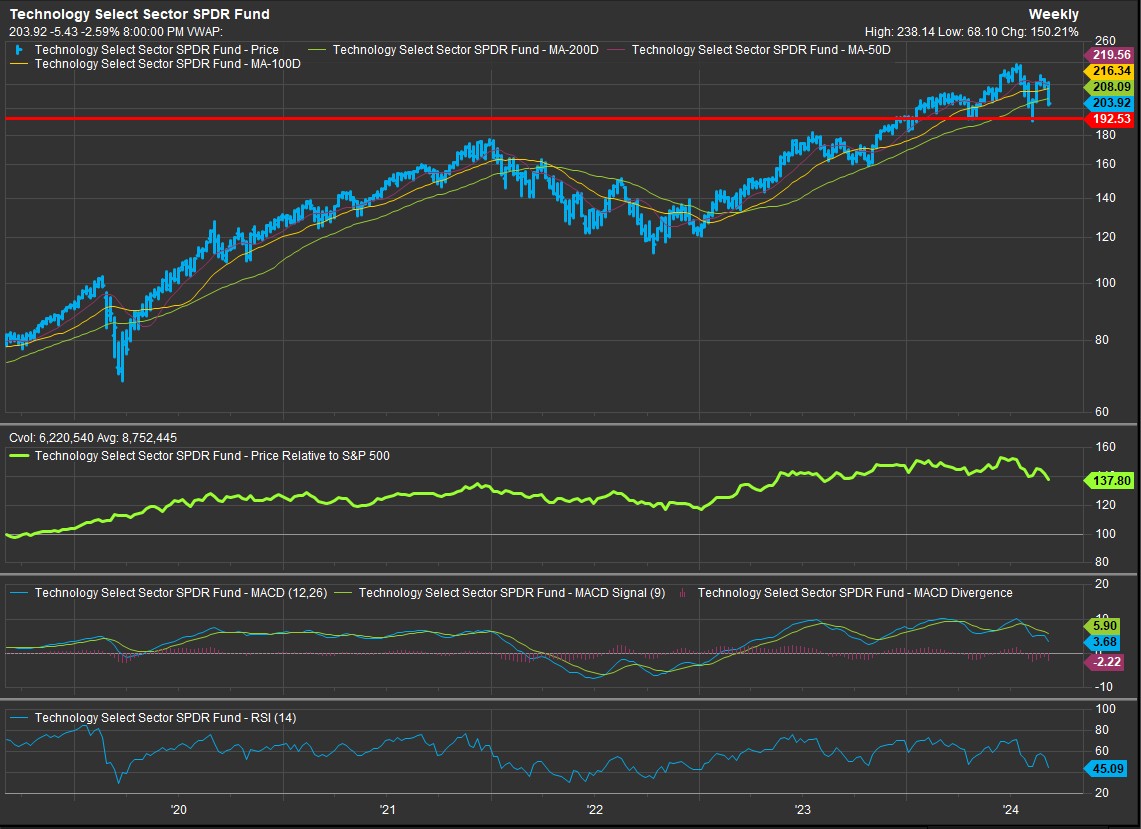
For those whose focus is on outperformance vs. the S&P 500 or other broad market equity benchmarks, the key question still resides with the Mega Cap. Growth trade. Is it over? Or is it a temporary pause? NVDA and XLK are oversold and the oscillator work for both is in a position where rallies have occurred in the past. We think the 192 level is important support for the XLK as it has capped both the April and early August corrections. We would be a buyer of XLK at that level. See the chart below and read on for our thoughts on the Mag7 at this point in the correction.
–Patrick Torbert, CMT | Chief Strategist, ETFsector.com
Sector ETF’s/The Week in Review
Sectors
What a difference two weeks makes. When we published our weekly missive on August 25, sector performance looked like this:
(Reposted from 8/25)

Now as some week ISM data came along right after a less than “knock your socks off” quarter from NVDA, we see sectors like this:

The XLK was the worst performing sector SPDR last week and now lags behind XLF, XLC and XLU over the past 12 months. The XLE has been the clear laggard over the past 12 months and in the bull cycle that initiated in early 2023 followed by XLY and XLB. There are times in every bull market cycle when it’s time to “shoot the generals”. We’ve seen that over the past two weeks as the Mag7 has come under fire. With defensive sectors now near-term overbought, the tactical crowd has a choice. Do you pivot to commodities sectors despite clear evidence of weakness there? Do you continue to crowd into the defensive areas of the equity market? Or is there a move back into oversold Growth shares now that they have been kicked around a bit? We think the coming week is an important test and we are maintaining our modest 2% long on the XLK with expectations that oversold conditions will be bought.
As the Mag7 go, so does our view of their sectors
XLC: META still looks good, the 2024 break-out projects to >$700 over the long term
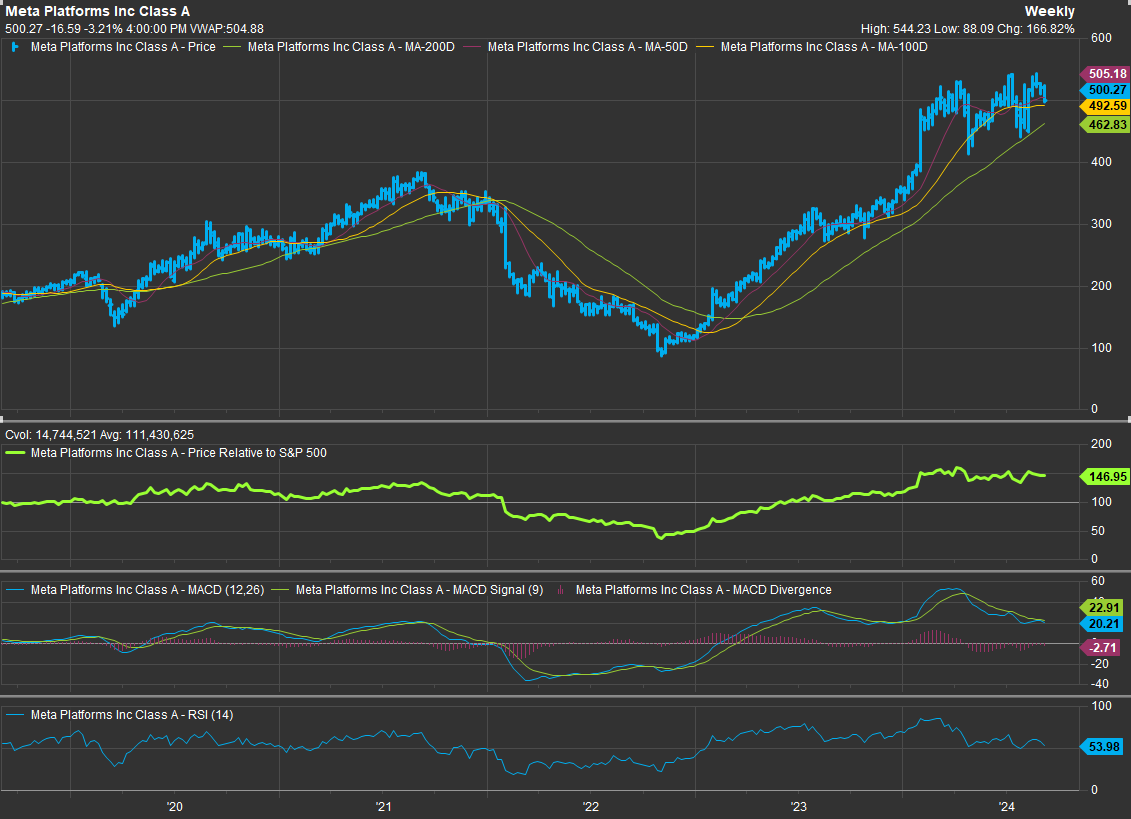
From a technical, chart-based perspective, META continues to be one of the most attractive stocks within the S&P 500. It has been consolidating sideways since a strong Q1 but looks bull trend oversold at present. Strong absolute and relative highs are confirmed on the longer-term chart despite near-term consolidation.
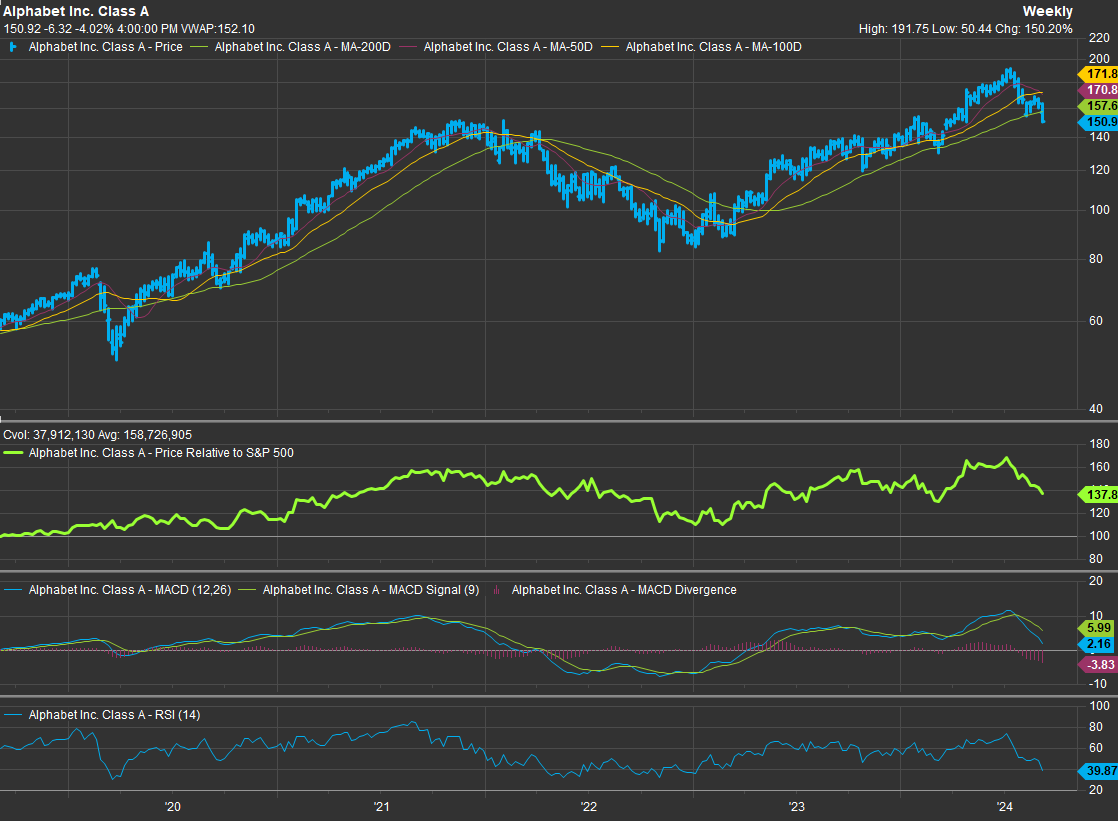
XLC: Alphabet is oversold Near-term. This looks like a good accumulation opportunity!
The 2021 high for GOOG was $149. Those highs typically act as the nexus for support for the following bull move. That’s the situation we are in now with the stock.
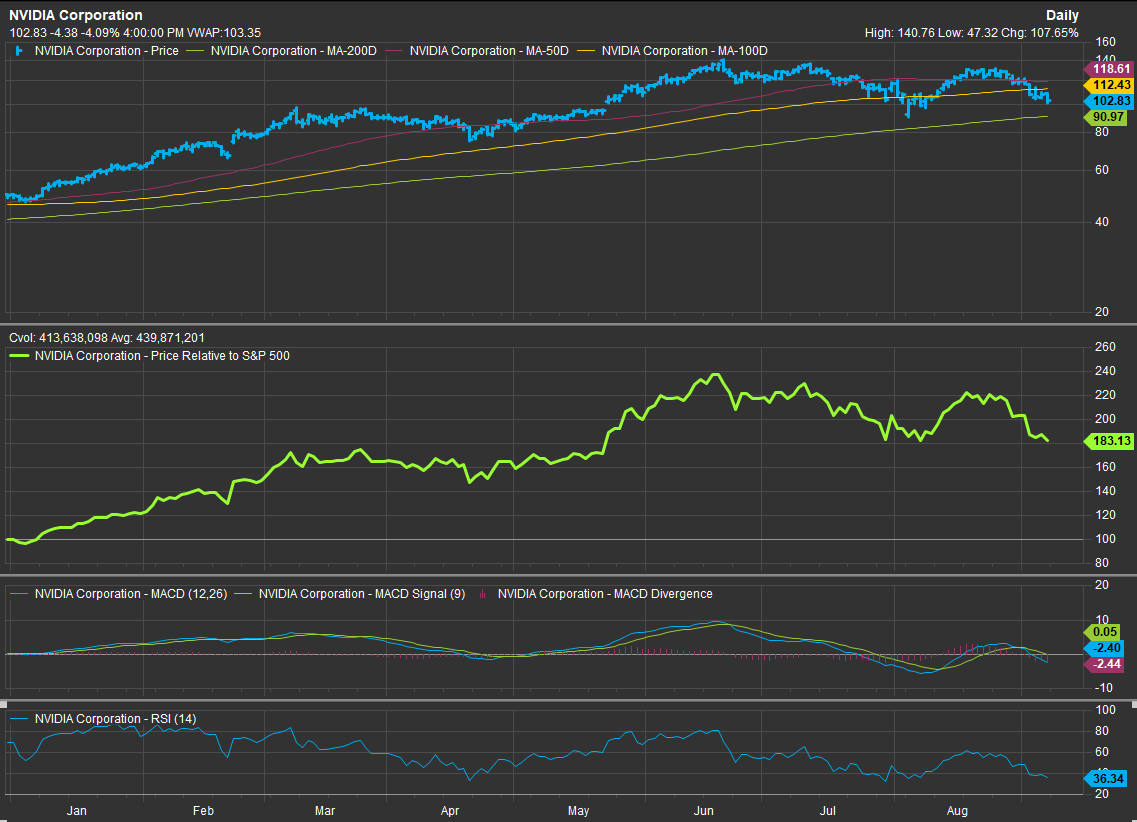
XLK: NVDA is on sale
We expect NVDA shares will prove too tempting as they test the $100 level. Support has been plentiful above $80 this year, and this is now the 2nd time the price gap higher in late May could get filled. We think the stock is at important support.
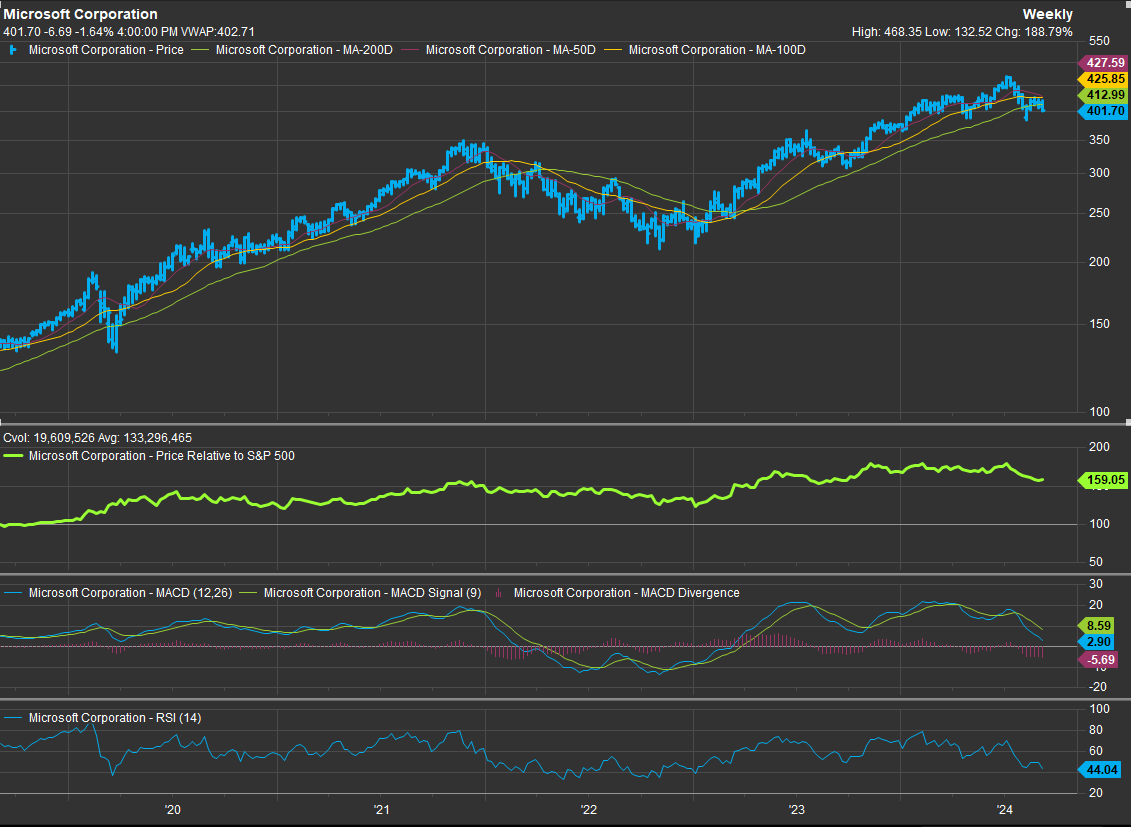
XLK: MSFT near-term price action is concerning, support at $350
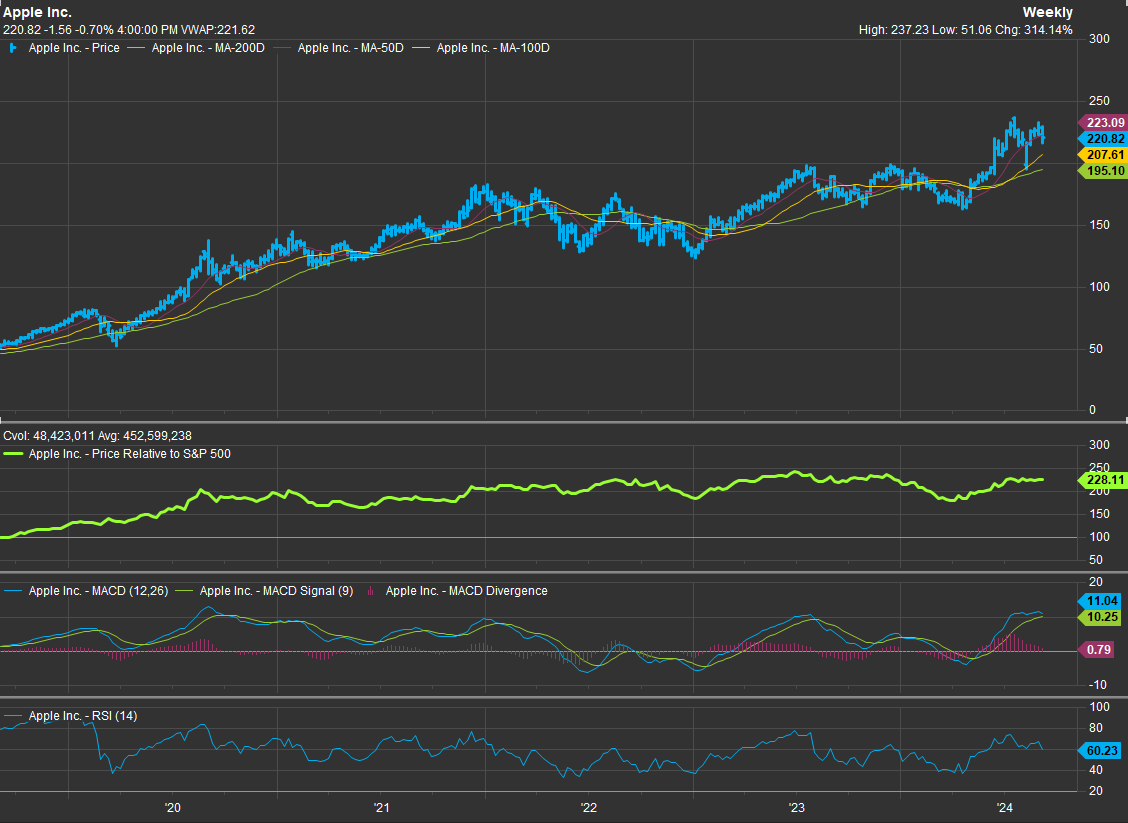
XLK: AAPL continues to be steady, strong support at $200
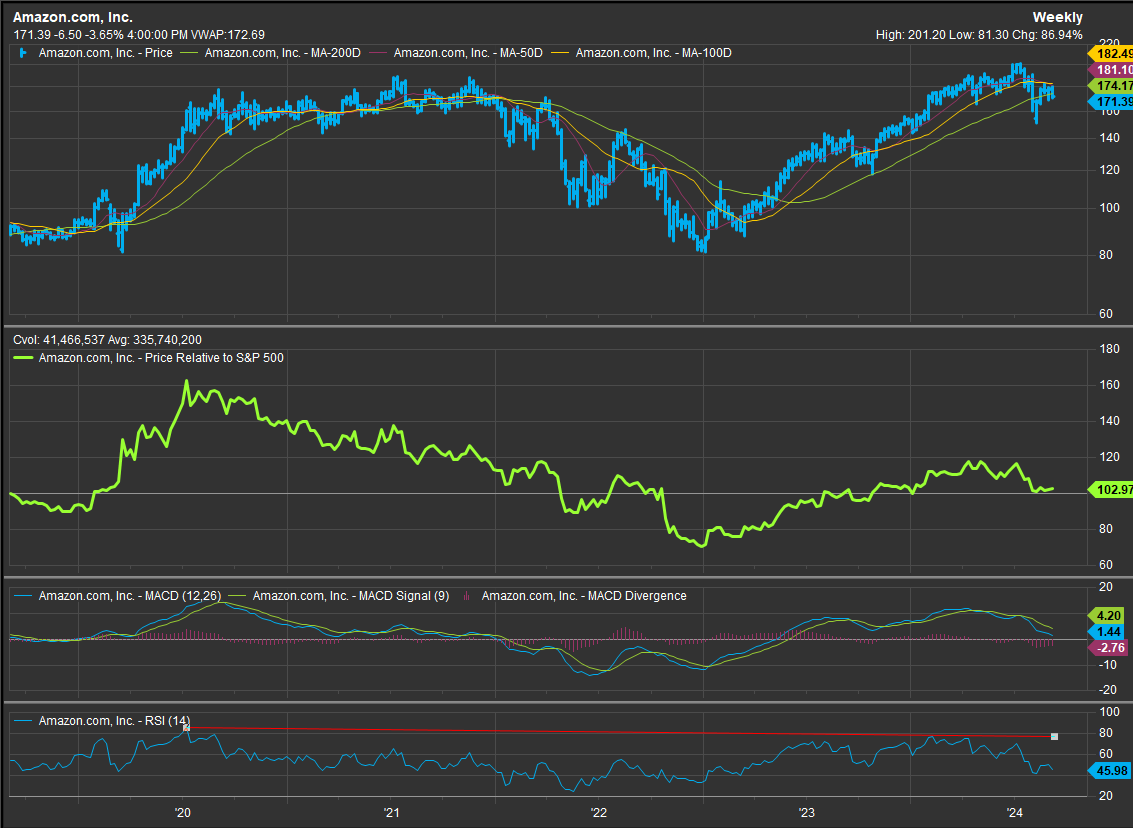
XLY: We are less sanguine on AMZN
The AMZN chart is showing some distributional qualities over the long term. Looking at a 5yr weekly chart (below), there is longer-term negative momentum divergence present on both the weekly MACD and RSI studies. The stock has outperformed in the bull market but over the longer-term the trajectory of its performance trend has been sideways
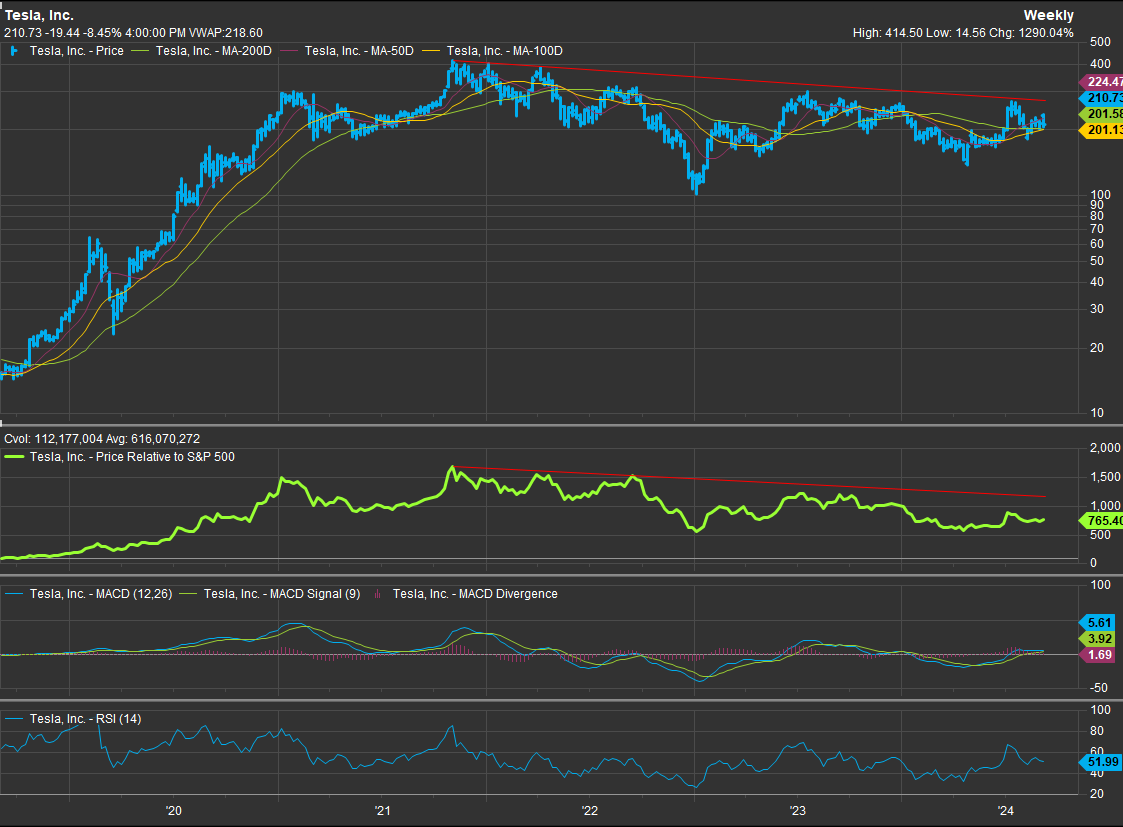
XLY: TSLA looks like a top to us, but the bull case gets more convincing if the price gets above $270-280
Conclusion
XLK, XLC and XLY are the three sectors dominated by the Mag7 and their various halo stocks. We like the technical condition of META and GOOG/L the most among the cohort. We find the XLK Mag7 names in decent shape and the XLY names (AMZN and TSLA) starting to show some signs of concern. As these names are on the threshold of clear oversold conditions, we look for the response from the buyer with NVDA off 40% from YTD highs.
Source: FactSet Data Systems

