Equities finished the week with the Dow on a rampage (+1.51%) while the S&P 500 finished higher (+0.80%) while the Nasdaq consolidated its near-term gains off -0.01%. Futures are up to start June with the small cap. Russell 2000 projected to open +1.29% and the Nasdaq100 Emini pacing large caps up + 0.52% before the open.
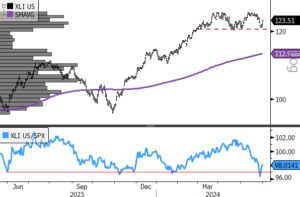
The Economic calendar offers ISM data releases on manufacturing PMI, new orders, prices paid and employment as well as construction spending. One of our bets for the month is some near-term improvement in XLI after a tough May. These data releases should give us some sense of where we are fundamentally after NVDA’s strong earnings release swayed buyers to chase Growth last month.
Eco Data Releases | Monday June 3rd, 2024
| Date Time | Event | Survey | Actual | Prior | Revised | |
| 06/03/2024 09:45 | S&P Global US Manufacturing PMI | May | 50.9 | — | 50.9 | — |
| 06/03/2024 10:00 | Construction Spending MoM | Apr | 0.20% | — | -0.20% | — |
| 06/03/2024 10:00 | ISM Manufacturing | May | 49.6 | — | 49.2 | — |
| 06/03/2024 10:00 | ISM Prices Paid | May | 59.5 | — | 60.9 | — |
| 06/03/2024 10:00 | ISM New Orders | May | — | — | 49.1 | — |
| 06/03/2024 10:00 | ISM Employment | May | — | — | 48.6 | — |
| 06/03/2024 | Wards Total Vehicle Sales | May | 15.80m | — | 15.74m | — |
S&P 500 Constituent Earnings Announcements by GICS Sector | Monday June 3rd, 2024
No S&P 500 Constituents release earnings today

- XLI (200-day m.a.| Relative to S&P 500)
- XLI is deeply oversold in the near-term, but if we are truly in a bull market expansion, shares should rebound soon.
Momentum Monday: LLY Continues to Advance
While much attention in the momentum space is focused on AI themed stocks and NVDA, LLY continues to pace the healthcare sector. Looking at the 3yr chart we can see the trend is accelerating higher, earnings are improving and the up trend in both absolute and relative terms is strong and intact. The chart shows a weekly RSI. When buying momentum stocks an “oversold” reading typically occurs just below the normal “overbought” line as you see has occurred in LLY from mid-2023 to present.
- LLY (200-day m.a.| Relative to S&P 500)
Sources: Bloomberg

