
Domestic Equity futures are a touch higher for Monday as of this writing after the Dow Futures contract topped 40K last week. It’s a light earnings and economic release day on Monday, but PANW will kick off some big software names reporting this week. NVDA earnings is likely he main course, but investors will also pick through jobless claims, durable goods and existing home sales data this week. For now, the table has been set with a bullish look to it.
From the technical perspective the SPX is making its way into near-term overbought territory while confirming the long-term bull-trend that has been emerging since early 2023. The XLK triggered a technical buy signal last week on the break-out to new highs and we have covered our short position we started out the month with and recommend a long exposure, with an eye on accumulating consolidation or pull-backs in instrument.
Eco Data Releases | Monday May 20th, 2024
| Date Time | Event | Survey | Actual | Prior | Revised | |
| No Releases | — | — | — | — | — | — |
S&P 500 Constituent Earnings Announcements by GICS Sector | Monday May 20th, 2024
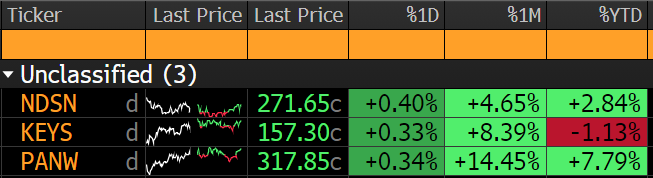
Light earnings calendar for Monday with LOW, INTU, NVDA , AZO, TGT, ADI and RL also reporting later this week. PANW will give us a glimpse of whether the software industry can potentially rebound from more than 6 months of lagging performance vs. the S&P 500. At present, the XLK is buoyed primarily by the Semiconductor Industry and a resurgent AAPL. Software has not joined the party.
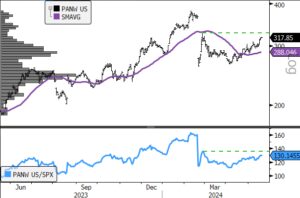
- PANW (200-day m.a. | Relative to S&P 500 )
- PANW is testing up to the important $326 level on the chart. That marks the bottom of the Q1 downward price gap. Price appears to be establishing support at the old highs of June 2023 and the chart looks constructive here.
Momentum Monday
Each Monday we discuss elements of Momentum investing. Today I want to take time to point out a key difference between the technical understanding of momentum and the quantitative understanding of momentum. The term is important to both disciplines, but they seek to leverage it in different ways.
The Quant reduces momentum to an equation. While specific quantitative analysts have their preferred way to measure it (e.g. Top Decile 12M Return – 1 Month Return) they are using equations to define what each stock’s momentum is and assign a numeric score or quantity to it.
The technician is looking for something similar in that they are looking for stocks that are going up materially over a given period of time, but they value the qualitative path the stock price pattern traces out on its journey. Generally, that pattern is an uptrend price structure that is maintaining consistent overbought readings over the intermediate to long-term (> 6 months up to several years).
When considered this way we come to the uncomfortable truth that in order to leverage the alpha-generating characteristics of momentum as a factor, investors generally need to be prepared to buy these special stocks at or near highs. It is of course lovely to be positioned in a stock that becomes a momentum stock before it is one, but the chart user can at least triangulate towards the best opportunities with a counter-intuitive strategy. That strategy is to take positions in stocks, ETF’s and other instruments that do register weekly overbought readings. Not all instruments that hit these weekly overbought readings go on to be famous Mo. Stocks, but every famous Mo. Stock that ever existed exhibited this characteristic very early on its journey. Fear not the new highs list!!
Consider the chart of XLK in this lens. Overbought certainly, but this is the point in the price structure where the next leg of the bull is confirmed. The initial momentum buy signal using this momentum approach came in late May of 2023.
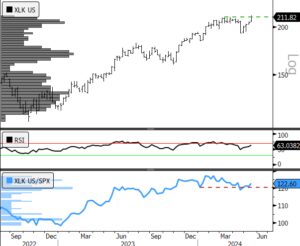
- XLK (Weekly | RSI | Relative to S&P 500)
- XLK chart has broken out to new highs projecting +10% upside based on the intermediate-term base break-out above resistance. We started out the month short the sector -100bps, and on the buy signal we are advising to close the short and open a corresponding long of +100 bps, funding from Natural Resources exposures in XLB and XLE.
