ETF Insights | February 1, 2025 | S&P 500 Energy Sector
S&P 500 Energy Sector Price Action & Performance
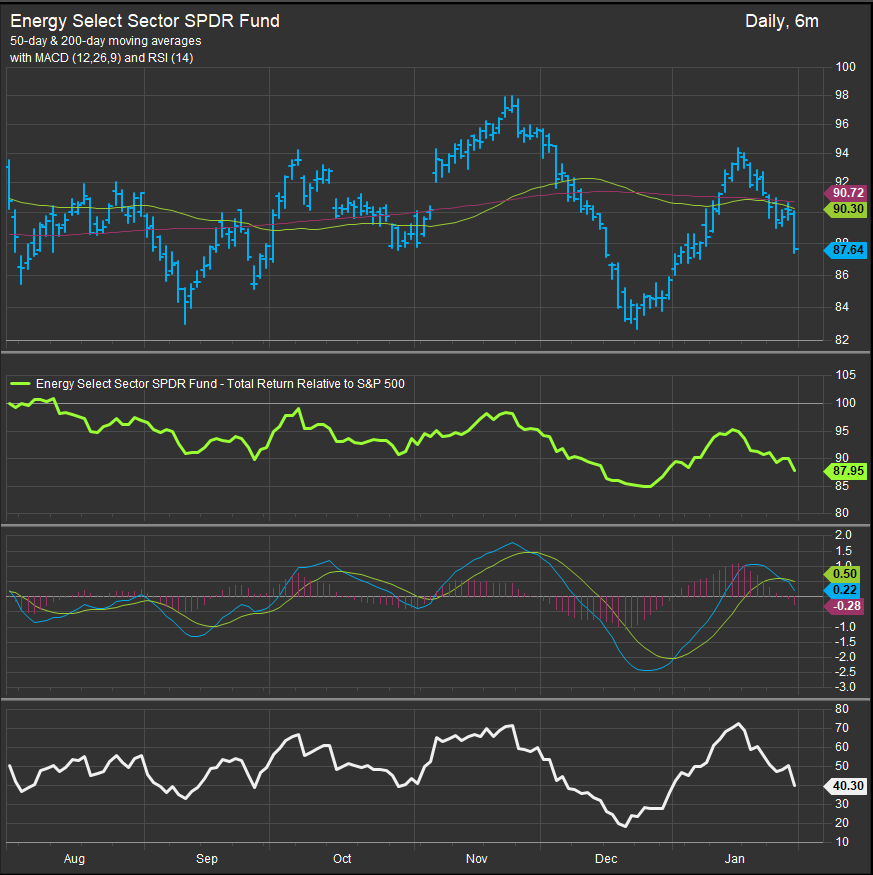
The Energy Sector started January rallying from oversold conditions, but mid-month saw a sharp pivot and a retracement of gains. WTI Crude started the month rallying, testing up as high as $80.73, before settling at $72.75 at month end mirroring the sector. Oscillator work shows a MACD sell signal (chart below, panel 3) with the RSI study moving back towards oversold levels.

S&P 500 Energy Sector: Industry & Sub-Industry Performance Trends
The chart below shows the Energy Sector and its industries’ total return performance relative to the S&P 500. The sector remains in a long-term relative downtrend that started in Q4 of 2022. The only standout theme within the energy sector is the Oil & Gas Storage and Transport Sub-Industry. This group of stocks, which includes MLP’s, pays out high dividends and has been the sole beneficiary of supply disruptions from global hostilities in Russia/Ukraine and the Middle East. We also think there’s a tailwind here when the long end of the interest rate curve is exhibiting volatility. That’s a dynamic we think has some staying power in 2025 and an area we’d be potentially interested in accumulating shares.

S&P 500 Energy Sector Breadth
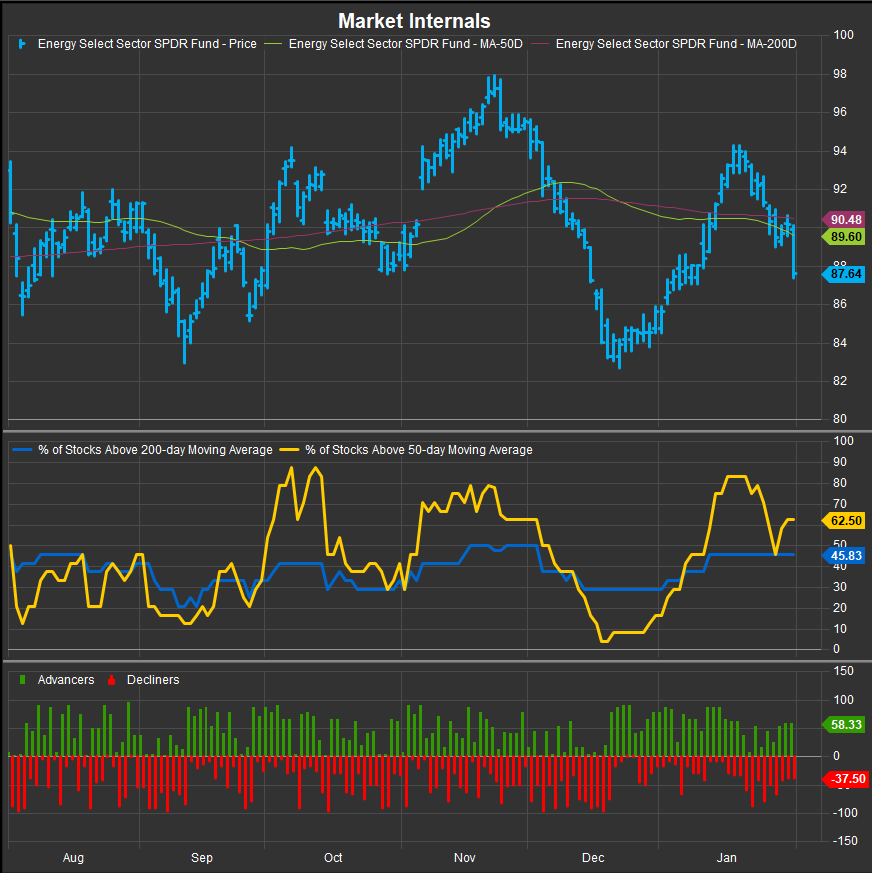
Emblematic of a sideways trend, the % of Energy Sector stocks above their 200-day moving average hasn’t been able to break above 50% over the past 6-months. Typically, the near-term (% above 50-day) study bottoms out at lower levels than where we are right now. We’re expecting more weakness to start February.

S&P 500 Energy Sector Top 10 Stock Performers
TPL rebounded sharply from a December retracement while BKR continues to build on its nascent bullish reversal. EQT and TRGP were also top performers and buy-rated in our work. We’re seeing some refining stocks do a bit better in the near-term as well which is typically a sign of economic strength.

S&P 500 Energy Sector Bottom 10 Stock Performers
Amont stocks that lost ground in December, we still have a favorable view on OKE, WMB and KMI. XOM remains a drag on the sector.

S&P 500 Energy Sector Fundamentals
The chart below shows S&P 500 Energy Sector Margin, Debt, Valuation and Earnings profiles on the bottom 3 panels. A classic story of an underperforming sector is playing out for Energy as margin is eroding, EPS is deteriorating and Valuation is moving higher as entrenched longs wait for a turnaround.

Economic & Macro Developments
The inauguration of President Trump on January 20 set off a wave of executive actions aimed at easing domestic oil and gas regulations. The administration declared an energy emergency, withdrew from the Paris Climate Agreement, and announced plans to refill the Strategic Petroleum Reserve (SPR). Additionally, Trump signaled potential 25% tariffs on crude imports from Canada and Mexico, which rattled refiners reliant on heavier crude grades. Uncertainty over implementation caused market swings, with reports on January 31 suggesting that the administration may delay the tariffs until March 1 for further review.
Extreme winter weather disrupted U.S. energy production throughout January. The Lower 48 saw a 226K bpd drop in crude output due to freeze-offs, with actual disruptions likely much higher. North Dakota experienced peak production losses of 130K-160K bpd, before recovering to 30K-60K bpd by the end of the month. The Department of Energy’s (DOE) Weekly Petroleum Status Report (WPSR) showed the first U.S. crude stockpile build in ten weeks, alongside an eleventh consecutive gasoline stockpile increase.
Global factors also played a key role in energy market movements. U.S. sanctions imposed on Russian crude on January 10 led to a sharp drop in Russian exports to China, with Bloomberg data showing shipments from Russia’s Ust-Luga terminal falling to a four-year low. Additional pressure came from Ukraine’s drone strikes on three Russian refineries, shutting down 600K bpd of crude exports from the Baltic Sea. In response to Trump’s demand for lower oil prices, several OPEC energy ministers held discussions, though no immediate policy shifts were announced ahead of the February 5 OPEC+ Joint Ministerial Monitoring Committee (JMMC) meeting.
Geopolitical & Policy Risks
Trump Tariff Uncertainty: Market volatility surrounding the potential 25% tariffs on Canadian and Mexican crude continued through January, with mixed signals from the White House. By January 31, reports suggested a possible delay to March 1 for further review, though the administration publicly denied any changes. Given U.S. refiners’ reliance on Canadian heavy crude, any tariff implementation could disrupt supply chains and impact refining margins.
Russian Sanctions & Supply Chain Disruptions: U.S. sanctions on Russian crude, imposed on January 10, have significantly impacted global oil flows. Chinese refiners have lost up to 1 million bpd in crude supply, while Russian crude exports from Ust-Luga fell to a four-year low. Meanwhile, Ukraine’s drone strikes on Russian refineries have further constrained supply, disrupting 600K bpd of exports.
OPEC+ Meeting Outlook: With oil prices falling amid Trump’s push for lower costs, OPEC ministers met at the end of January to discuss potential production adjustments. The group’s February 5 JMMC meeting will be closely watched for any response to U.S. policy pressure and ongoing Russian supply disruptions.
Inventory & Demand Trends
Crude & Refined Products:
- U.S. crude stockpiles posted their first build in ten weeks, reflecting production recovery from freeze-offs.
- Gasoline inventories increased for the 11th consecutive week, though distillate stockpiles remain 9% below the five-year average.
- Gulf Coast refinery utilization fell 8.7% to 85.9%, leading to regional supply imbalances and impacting product flows.
February Outlook
Macro Themes to Watch:
- Trump’s tariff decisions and potential refiner exemptions for Canadian crude.
- OPEC+ response to U.S. price pressures and Russian sanctions.
- Production normalization after winter weather disruptions.
- Chinese Lunar New Year demand boost and refinery run rate increases.
Upcoming Energy Earnings Reports:
- February 5: ConocoPhillips (COP) pre-market earnings.
- February 6: Baker Hughes (BKR) post-market earnings.
- February 7: ExxonMobil (XOM) and Phillips 66 (PSX) pre-market earnings.
With policy risks, global supply disruptions, and market volatility in play, February is set to be another pivotal month for the energy sector. Investors will closely watch upcoming earnings reports, OPEC+ policy responses, and any shifts in U.S. tariff decisions for further direction.
In Conclusion
We got half a month of outperformance from the Energy sector in January despite being long for the whole month. Neither the technical, macro or fundamental picture is supportive of the sector. We are back to a zero-weight allocation in the Elev8 model to start February with a resulting exposure of -3.37%.
Data sourced from Factset Research Systems Inc.
