
April 21, 2026
The recent equity advance has been impressive on the surface, but price alone is not the signal that matters here. If we want to know whether this move is becoming a true melt-up rather than just a sharp rebound, the better test is breadth — specifically, the percentage of stocks trading above their 50-day moving average.
That series has improved dramatically, and we are seeing continued signs of improvement towards a market level buy signal.
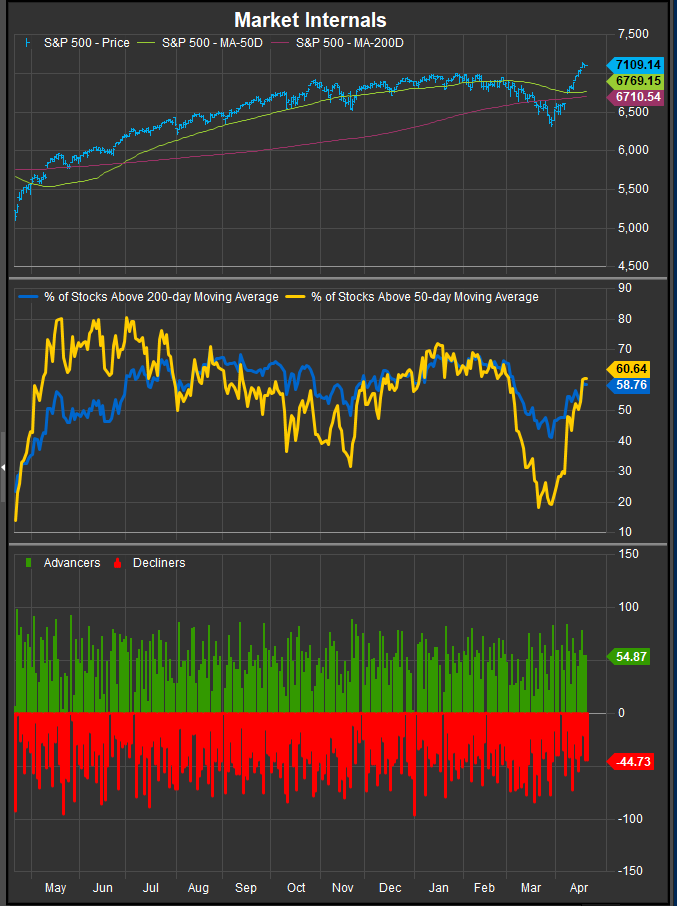
Currently, 60.64% of S&P 500 stocks were above their 50-day moving average. That is a major recovery from the washout readings of 18.49% on March 20 and 19.48% on March 30. In other words, the market has gone from fewer than one in five stocks holding short-term uptrends to roughly three in five. That is real progress, and it tells us the rally is no longer purely a handful-of-winners story.
But a melt-up demands more than improvement. It demands confirmation.
In this framework, that confirmation is simple: the percentage of stocks above their 50-day moving average must break to a new six-month high. That has not happened yet. The prior six-month peak in your data was 71.97% on January 15, 2026. The current reading of 60.44% is still 11.53 percentage points below that threshold. So while participation has broadened, it has not broadened enough to declare that the market has entered a durable, self-reinforcing upside phase.
That distinction matters.
A rebound can be driven by short covering, relief that macro fears did not worsen, or renewed enthusiasm for the index leaders. A melt-up is different. A melt-up says the macro backdrop is strong enough that the gains are escaping the narrow leadership cohort and spreading across the market. It means more cyclicals, more financials, more industrial names, more secondary growth stocks, and more rank-and-file constituents are reclaiming their intermediate trend. It means the advance is no longer being carried — it is being sponsored.
That is why the 50-day breadth measure is such a useful proxy. It tells us whether the average stock is participating in the same story the index is already pricing in. When that series makes a new six-month high, it signals that the market is no longer just rising; it is widening. And when rallies widen, they tend to become more durable, because they are supported by a broader set of earnings expectations, sector responses, and investor flows.
The percentage of stocks above their 200-day moving average has also rebounded, reaching 59.36% on April 21 from 41.43% at the March 30 low. That tells us the longer-term technical damage is healing. But healing is not the same as a fresh upside regime. The market has moved from oversold to healthier. It has not yet moved from healthier to unequivocally broad-based.
The right read today is to be constructive. A market that can lift 50-day breadth from under 20% to above 60% in a month deserves respect. It argues against fighting the tape. The S&P 500 itself has rallied from 6,343.72 on March 30 to 7,109.14 on April 21, a gain of roughly 12%, and breadth has clearly recovered alongside it. That is enough to justify a constructive stance.
We’re getting bullish near-term action from Financial and Consumer Discretionary Sector breadth measures (below). 98% of the Discretionary sector outperformed on Friday April 17 and Monday, April 20, 2026. That’s evidence of bullish capitulation and is a constructive pre-cursor to our market level breadth signal. However, breadth confirmation is still critical as the XLY remains in a negative intermediate-term price trend with a lower-low in late March rallying to overbought levels below all-time highs.
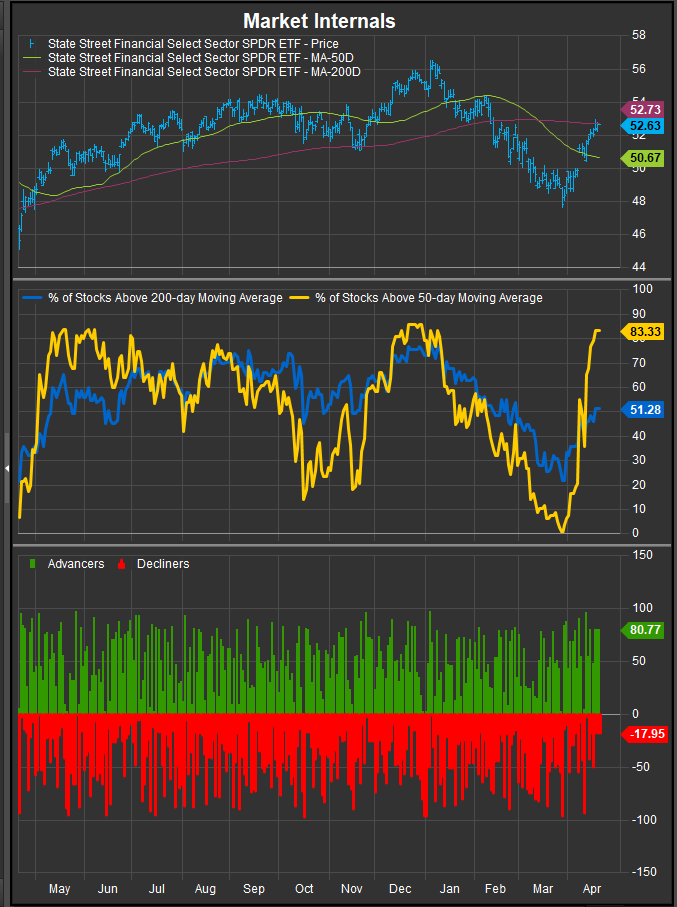
Financials have authored the kind of bounce on broad participation that we want to see.
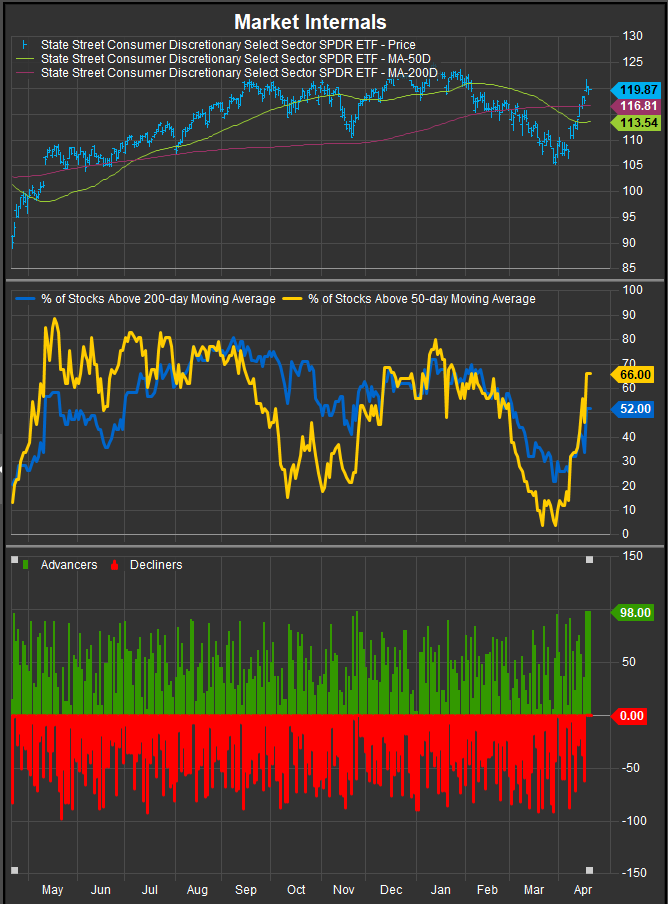
Discretionary stocks (XLY) have improved and are triggering bullish capitulation with >90% of stocks advancing since Friday April 17.
The bullish regime switch is signaled when breadth clears the trigger the market has already set for itself. In practical terms, that means the percentage of stocks above their 50-day moving average needs to exceed 71.97%, taking out the January 15 high and registering a new six-month high. That would be the point where the rally stops looking narrow and starts looking self-validating.
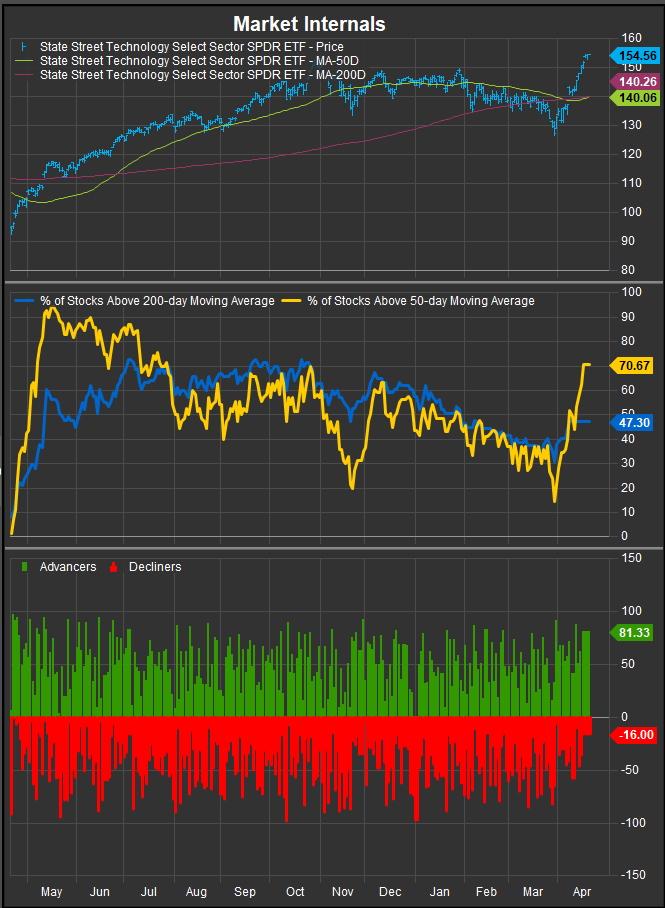
Technology Sector Breadth has seen the short-term series make new 6-month highs.
Until then, the message is disciplined optimism. Short covering in the Tech sector is certainly warranted. Financials have shown improvement and should be upgraded. Industrials, Materials and Healthcare sectors have been lackluster which is a cautionary sign that despite geopolitical relief, sticky high rates, sticky high prices and the potential for inflation are still headwinds to demand despite renewed AI optimism. Relief is welcome, but vigilance is still called for.
