We wanted to put out a report on the presidential cycle today in honor of our democracy and our elections. We are studying the presidential terms that coincide with the modern stock market from 1941-present. We think this period is the most germane to the present because the structure of the equity market and the way we analyze and value companies changed dramatically in the 1930’s as a result of the 1929-1932 market collapse and the resultant “Great Depression”. The 1930’s and 40’s saw a wave of legislation and the establishment of institutions that are still vital to the functioning of our financial markets today.
The concept of GAAP began developing in the 1930s after the Securities Act of 1933 and the Securities Exchange Act of 1934. These acts created the Securities and Exchange Commission (SEC), which had authority to establish accounting standards for publicly traded companies. The Glass Steagal Act of 1933, The Securities Exchange Act of 1934, The Investment Company Act of 1940 and the Bretton Woods Agreement of 1944 were all instrumental in shaping regulation and analysis of equities.
We looked at annual returns, and we are counting each presidential term’s attribution starting with the first full year in office, rather than the year where the election takes place, so, for example former president Trump is attributed 2017-2020, while former president Obama is attributed the year 2016.
Our analysis is as follows, “# of Occurrences” = # of Years in the Period where the Condition was True:
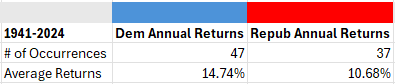
Democrats have held an edge in average annual return going back to 1941
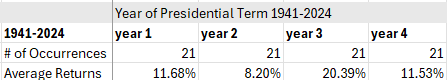
Regardless of Party Year 3 is the Strongest Year of the Presidential Cycle
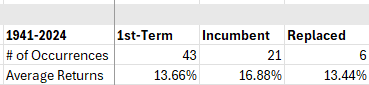
Incumbents Historically Do Better than 1st year Candidates and Candidates Replaced in Office
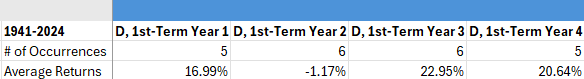
1st Term Democrats have seen excess returns in year 1, 3 and 4 of their administrations on average
Incumbent Republicans* are strong in year 2, but have seen equities struggle in the last year of their term. (* we not Former President Trump is not technically an incumbent despite being president before so we include incumbent and 1st term stats here)

Conclusion
We highlight these results to show that the modern stock market has historically gained >10% per annum regardless of which party is in control of the Whitehouse. There are of course many ways to slice and dice the data, and we are not considering control of Congress in this exercise. However, we do find it interesting that many people we talk to claim that Republicans are a better choice for investors and the equity markets return profile when the high-level results of our study shows the opposite over the past 84 years. Regardless of the analysis, we hope to see an orderly transition of power and a free, fair and safe election for everyone.
Data sourced from YCharts, Slick Charts, Nasdaq, Visual Capitalist, Encyclopedia Britannica
