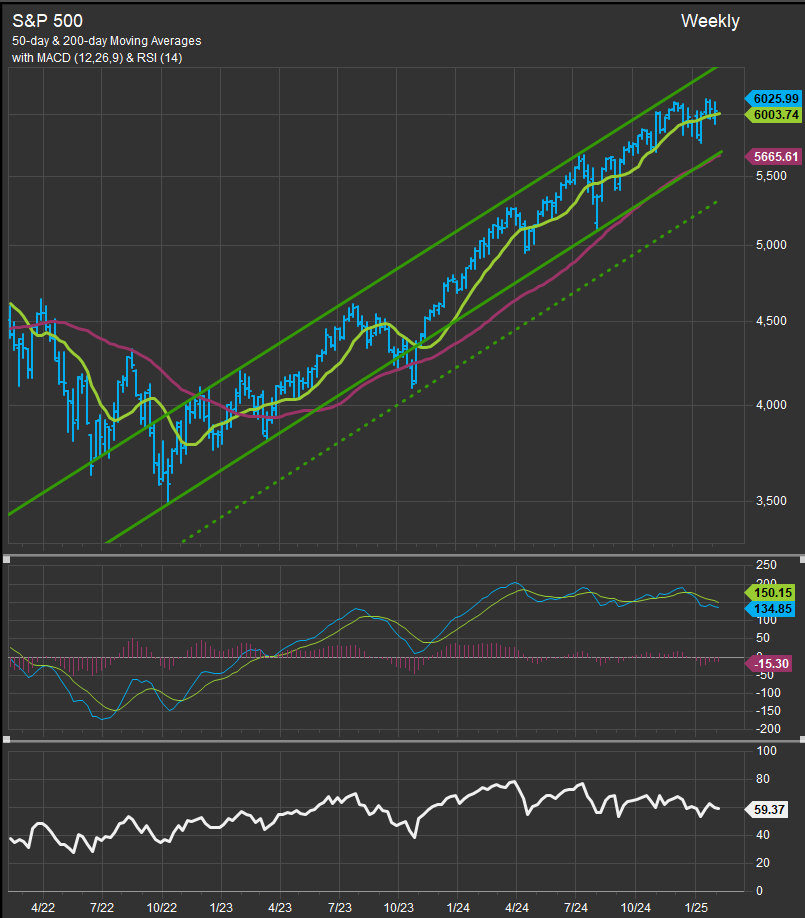
The S&P 500 continues to move sideways across its long-term uptrend channel (chart below). After hitting uptrend channel resistance, it looks like prices are consolidating sideways in a bid to correct the trend in time rather than price. The 200-day moving average, currently at 5665, is a good proxy for trend channel support and we’ve also mentioned 5722 as a key level representing the bottom of the election day 2024 “price gap” which has acted as support YTD.
Growth vs. Value at Equilibrium in February
During the consolidation, Growth and Value have settled on an uneasy equilibrium as Value performance fluctuates on the strength of economic data while Growth digests the latest skepticism around the AI narrative. Our large cap. factor performance chart (below) shows a stalemate in the near-term. Today, we are reviewing the signals we will look for to indicate whether Growth or Value styles is emerging with the upper hand.

Commodities
The chart of the Bloomberg Commodities Index (below) is making a bid to test long-term resistance at the 108-110 level. The chart below shows the basing action in commodities prices through 2023-2024. Value stocks historically benefit from rising commodities prices relative to Growth stocks. Price making new multi-month highs through 110 would support value.

Interest Rates
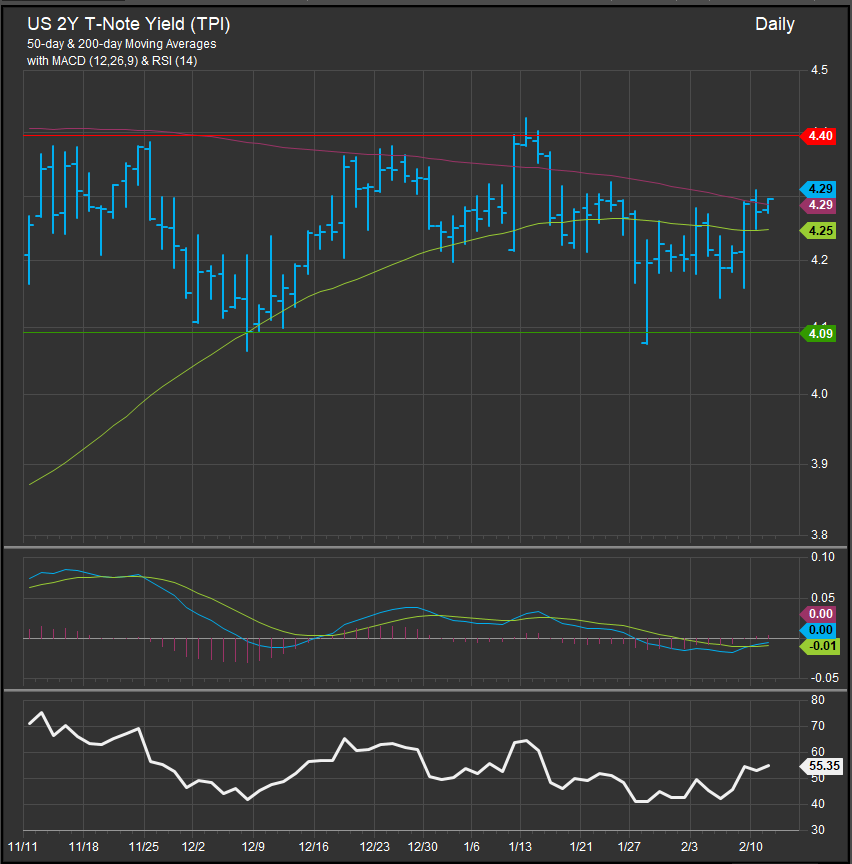
The chart of the 2yr Treasury Yield is consolidating in a fairly tight range between 4.1% and 4.4% (presently 4.29%). A break-out from that range would likely be signal with an upside break-out confirming Value and a downside Breakout supporting Growth. The exception here would be if the S&P 500 rolls over to the downside with rates, then we’re getting a recessionary signal, and we’d want to move to defensive exposures.
Mag7
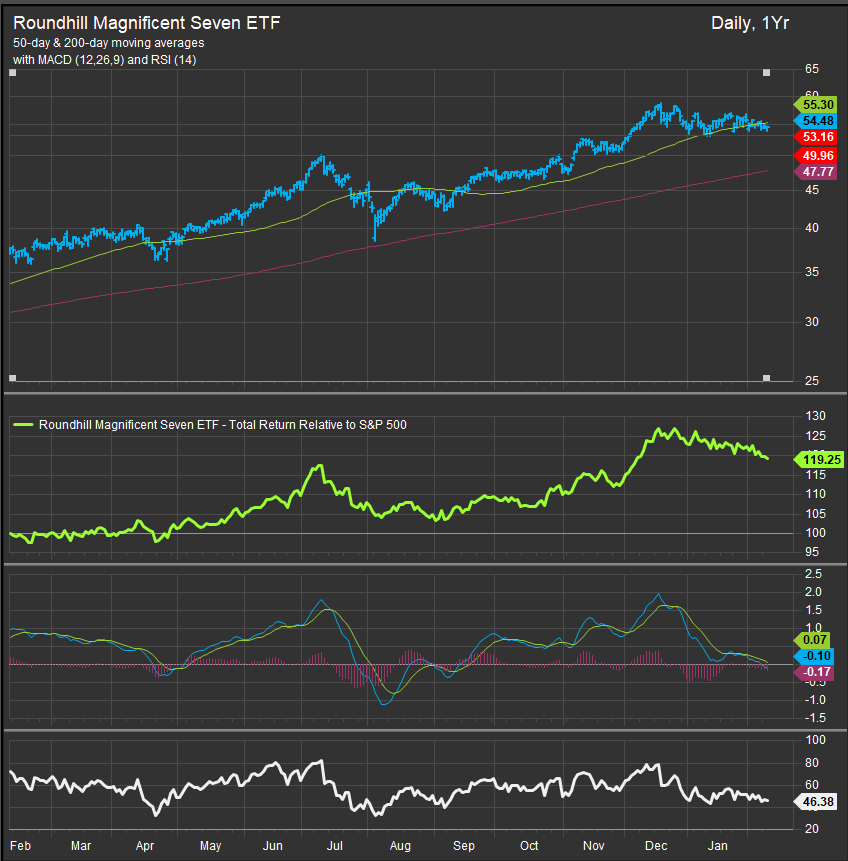
The Roundhill Magnificent Seven ETF (MAGS) is a useful proxy for our bull market leadership cohort. Mag7 performance has consolidated since December highs and both he price and relative curves are near a support level. A break-down below $53.16 would be a bearish “tell”, while a move below $49.96 would confirm a bearish reversal and likely indicate a deeper retracement.
Semiconductors
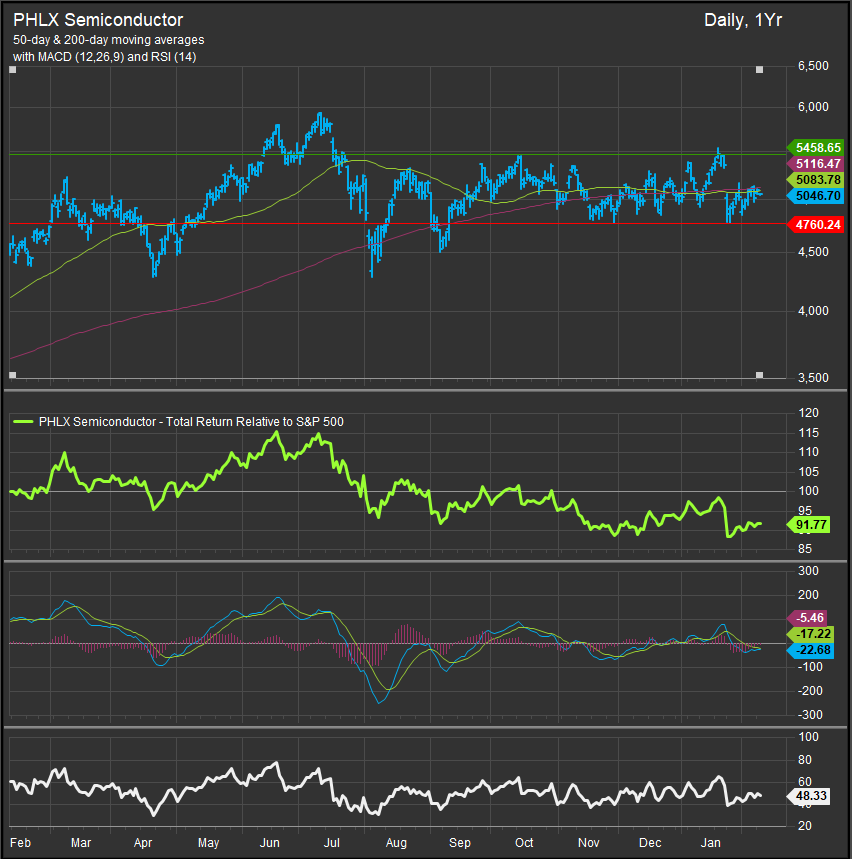
Semiconductors have been in an ambiguous consolidation since September. Recent weakness comes just as the index had made a new multi-month high, and yesterday’s decline has us back at the bottom of the range. Per the chart below, a violation of near-term support at 4760 would setup a likely retest to 2024 lows near the 4288 level which would represent a > 10% draw down from today’s prices. A move above 5460 would indicate bullish reversal for Semiconductors.
Conclusion
Consolidations by their nature are ambiguous. We laid out the contours of our signals for Growth vs. Value outperformance. Summing the weight of technical evidence, we find the bull trend losing momentum due to deceleration in the Growth trade. Value has outperformed in the near-term, but hasn’t triggered our signals for long-term trend reversal. We see negative momentum divergences showing up most prominently in Information Technology stock charts, particularly Semiconductor stocks. We’re looking for our indicators to confirm the pivot over the next week or two.
Data sourced from FactSet Research Systems Inc.
