
April 15, 2025
The S&P 500 has pivoted off a significant long-term support level at 4818 which marked the top of the post-pandemic advance for equities (chart below). Price has traded up to the bottom March’s trading range which encompassed 5504 to 5786. We think that zone is the “neckline” for a potential top in the index, but the high end at 5786 is also the threshold to gain to signal potential bullish reversal for the index.
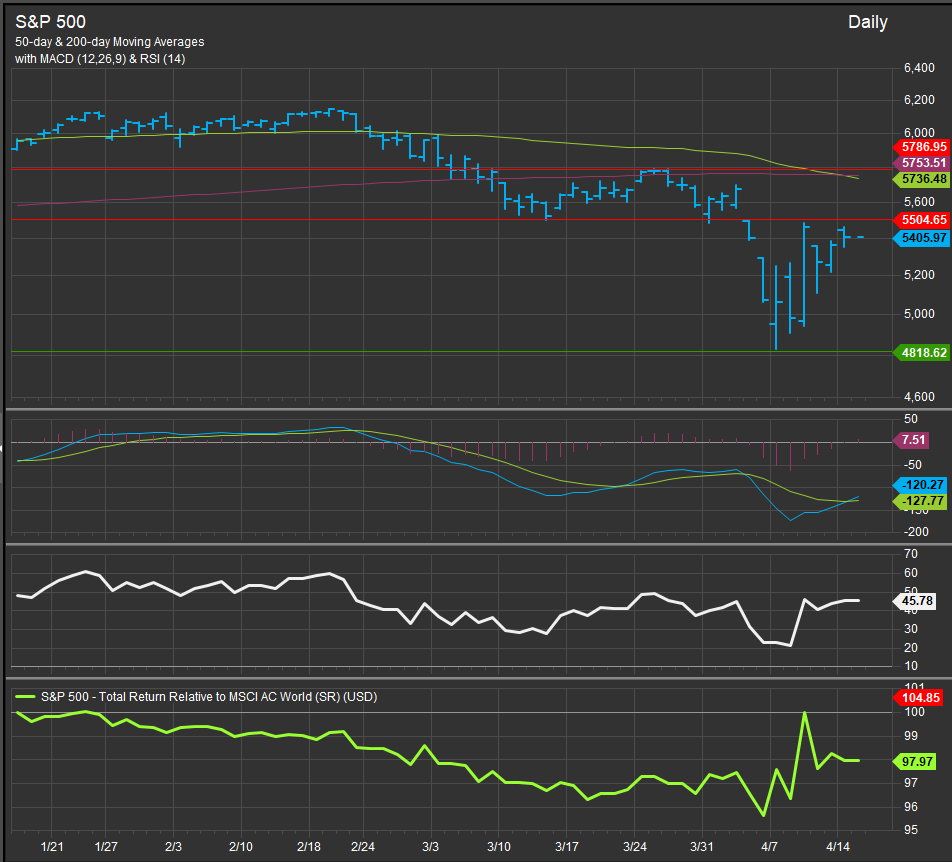
The major moving averages are just below the top of that trading range and are a sign post themselves. We also think the performance of the S&P 500 vs. the MSCI All-Country World Index (ACWI) will be revealing. The recent tariff-related drawdown has come with ex-US equities leading US equities and the near-term bounce for the S&P 500 has shown the opposite leadership profile.
Our Elev8 Sector Rotation Model is positioned for more consolidation and bottoming in the near-term, but we continue to look for signs of positive divergence in higher beta areas of the equity market to build conviction that we’re at a tradeable low. At present, we think another retest of support at the 4818 level is likely.
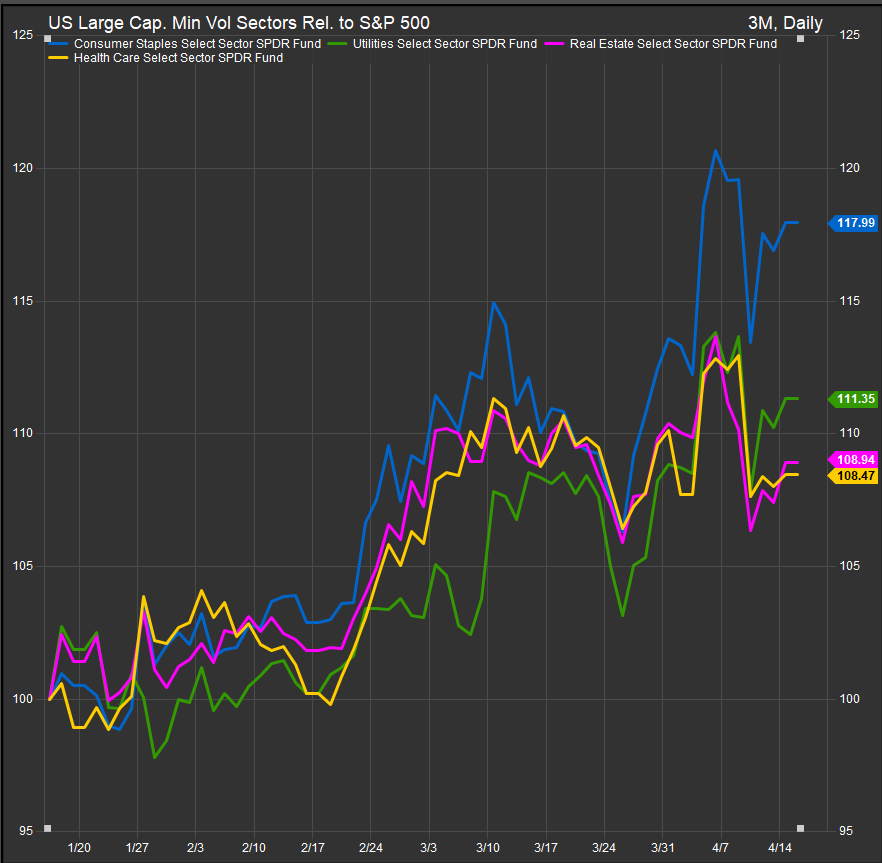
The chart below shows our defensive sector’s (HC, Staples, Utilities & Real Estate) performance relative to the S&P 500 over the past 3-months. The recent “pop” in the S&P 500 came with a retracement of near-term gains for defensive shares but sets up an accumulation opportunity if more turbulence comes our way. We think there’s enough uncertainty around the macro-outlook to keep risk appetite in check.
The correction is maturing towards a tradeable low, but we think there’s likely more to shake out.
