July 8, 2025
Equities recently posted all-time highs as proxied by the S&P 500. Risk appetite has been strengthening; interest rates remain contained and high beta stocks are outperforming. With the Q1 equity correction now firmly in the rearview mirror, we are shifting our focus to try and ID new leadership trends at the sector, industry and stock level.
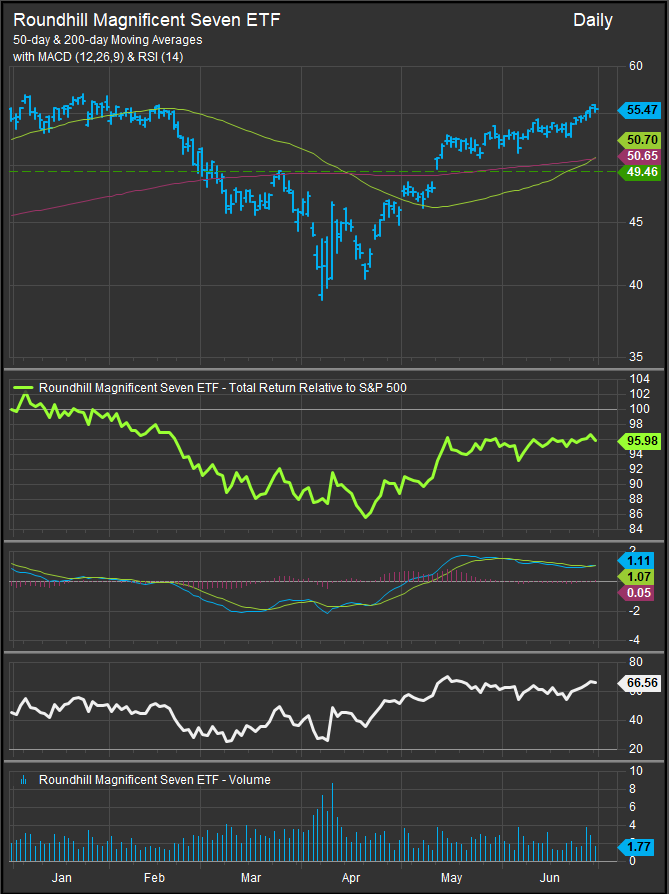
The first leg of the present long term bull trend kicked off in early 2023. With the present realignment and global trade playing out we Notice mag 7 stocks are improving in aggregate, but they are not leading the tape in the near term (chart below). For the past six weeks these mega cap growth names have been treading water in aggregate as several members of the cohort (AAPL, GOOGL and TSLA) Have faced an overhang of selling pressure. While five of the seven constituents remain buy rated in our technical process, buyer behavior regarding this group of stocks has clearly changed. You think this opens the door for other high beta opportunities and we expect the leadership profile of the US equity market will broaden out concurrent with the continued bull trend.
The big question on our end is which sectors are likely to lead if Technology outperformance pauses. Our technical process looks for fresh breakouts at the stock industry and sector level, but we also use historical trend analysis to give us an idea of what the playbook should be for a continued bull market. This allows us to narrow our hunting ground to smaller and more manageable universes of stocks and allows us to place some bets ahead of bullish price action as we bet on potential accumulation in historical offensive exposures.
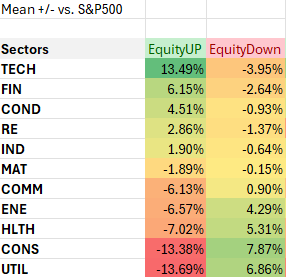
The tables below look at S&P 500 GICS Sector performance and the top twenty industries and sub industries within the S&P 500 based on their average excess returns vs the benchmark when equities are trending higher over multi-month periods going back 30 years. There are some distortions to the data as newer Sectors and Industries (e.g. Comm. Services Sector, Interactive Media Industry) don’t have the same deep history as others, but we can see where historical outperformance has come from during previous bull trends within each sector.
GICS Sector Excess Returns | Mean | S&P 500 Uptrends 1995-present
GICS Industry/Sub-Industry Excess Returns | Mean | S&P 500 Uptrends 1995-present
We’ve added historical coincident excess returns for interest rate trends, commodities and USD here so investors can appreciate the macro cross currents that exert influence on stocks. One of our key pivots in 2025 is which way interest rates will break as they’ve spent almost two years consolidating between 4.15% and 4.8%. Give them at the market is a discounting mechanism should pay close attention to whether inflationary role market leaders or deflationary bull market leaders are preferred.
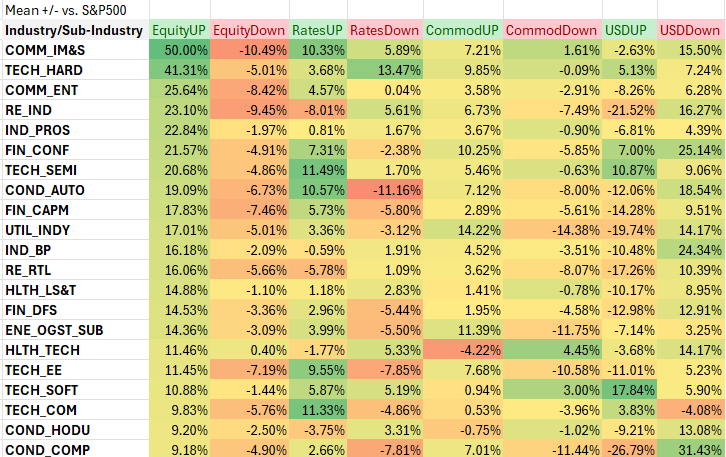
At present, the equity market is keen on bullish exposures that historically have outperformed when interest rates are rising. Investors are showing a preference for entertainment, consumer finance, capital markets, auto components, electronics and networking which typically do well when interest rates are rising. Real Estate sector exposures, home building plays and industrial services are lagging in the near term despite historically outperforming in equity uptrends.
Data sourced from Factset Research Systems Inc.
