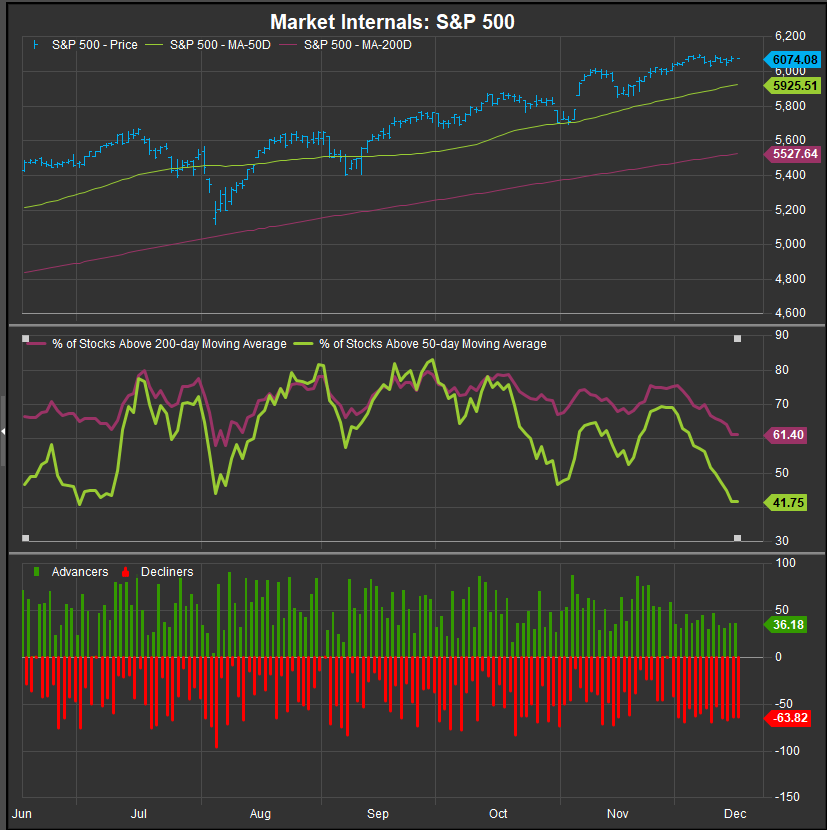
The S&P 500 persists above the 6000 level in a multi-year uptrend, however, measures of internal strength for the broad index show deterioration at the stock level. This isn’t an outright sell signal on its own as the dynamics of the bull market have oscillated between Mega Cap. Growth leadership and “everything else” leadership a few different times in this cycle without breaking the bull. That said, uptrends aren’t something to take for granted and our volatility gages, VIX and MOVE, are showing complacency which can set the table for sharp corrections when unlooked for bad news hits the tape.
S&P 500 Market Internals: We’d like to see the price action in the average stock improve to stay sanguine on the bull trend
The chart below shows stock level deterioration in December despite the top line index trading to new all-time highs during the month. We have seen the Energy and Materials Sectors lag in the near-term unable to buck the headwind of weak crude and commodities prices. We’ve also seen historically lower vol. Sectors roll over as Donald Trump’s election and dovish Fed policy increased investor risk appetite in the near-term. However, the chart below is showing negative divergence in our breadth series, and we note that Financials are correcting near-term as well, despite historically outperforming in bull trends. Panel 2 of the chart shows % of stocks above their 50-day and 200-day moving average. Both those series are currently at levels where we would expect a pivot to the upside. Given that the last two weeks of the calendar year are historically bullish from a seasonal perspective, we aren’t sounding an alarm yet, but we want to see improvement from the average stock to strengthen bullish conviction as the calendar flips to 2025.

On the bottom panel of the chart above, the daily advancers/decliners series shows that December gains have been powered by less than 50% of the stocks in the Index. A healthy trend typically has broader participation. We need to see a confirmation from market breadth in the next few weeks to alleviate our concerns here.
Investors like to buy pullbacks or “dips”, Here are some areas where we think “dips” look buyable
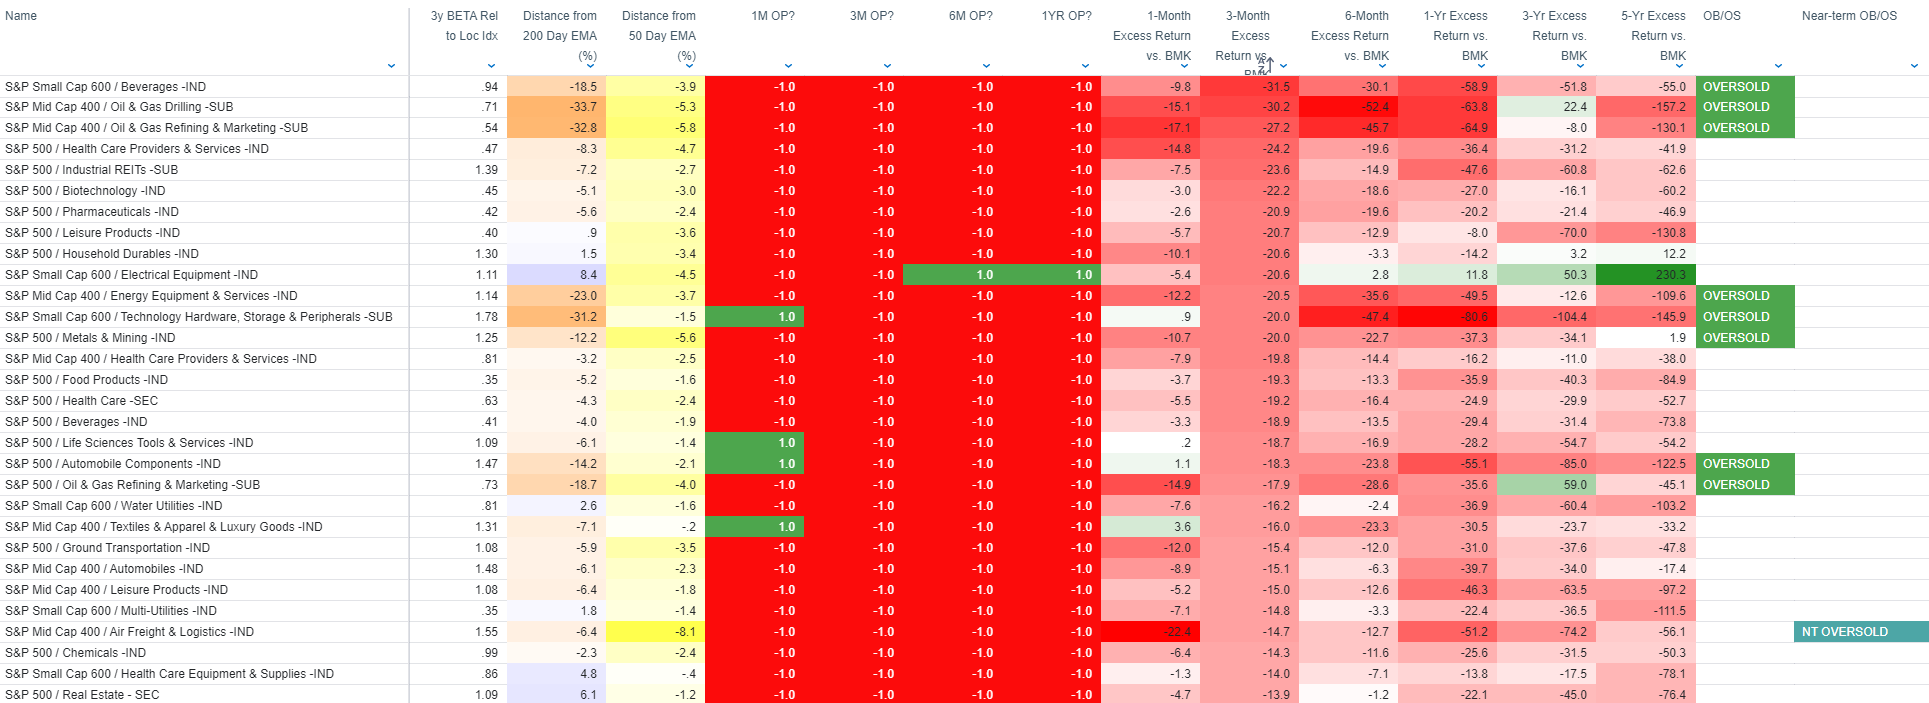
As we noted in the previous section, there is no shortage of stocks, sectors and industries that are correcting in the near term even as the S&P 500 has moved higher. We generally are of the opinion that stocks in weak trends should be avoided until they show some significant signs of bullish reversal. However, we generally favor accumulating stocks that are in strong longer-term trends when they have corrected materially in the near-term. The table below shows S&P Large, Mid and Small Cap. Sectors, Industries and Sub-Industries sorted by 3-month excess returns from lowest to highest. We’re showing the top 30 underperformers.
When looking at the top 10 underperformers over the past 3-months, only two areas have underperformed by > 10% vs. the S&P 500 but still show positive results over multiyear timeframes. Those are Small Cap. Electrical Equipment and Large Cap. Household Durables. These two industries fit the profile of being “buyable dips” in our process currently.

Stock charts tell the story: Homebuilders a potential accumulation opportunity
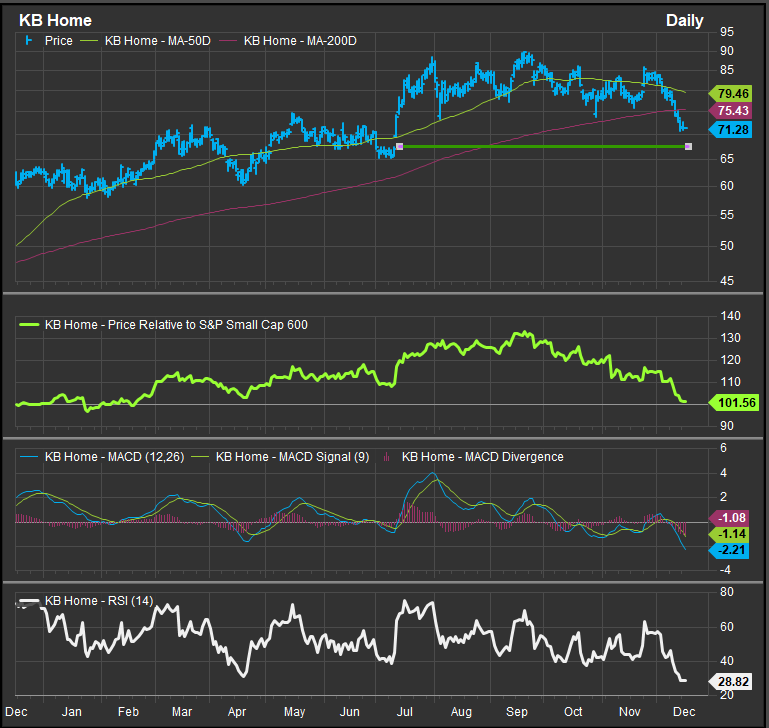
What you get from this “dip buying” approach is generally stocks that have been in long-term uptrends that are very near-term oversold. Research discipline still applies. Homebuilders for example should only be accumulated if interest rates stay contained and the economy continues to expand. The chart below is KBH. This stock has retraced its YTD gains and is at a near-term support zone between $65-70. We’d be tempted to take a position at $65, but we also don’t need to be macho about it and try to catch the falling knife here. What we advocate is for investors to ID these opportunities and then step in when expected behavior (accumulation) starts to occur.

Data sourced from FactSet Research Systems Inc.

