

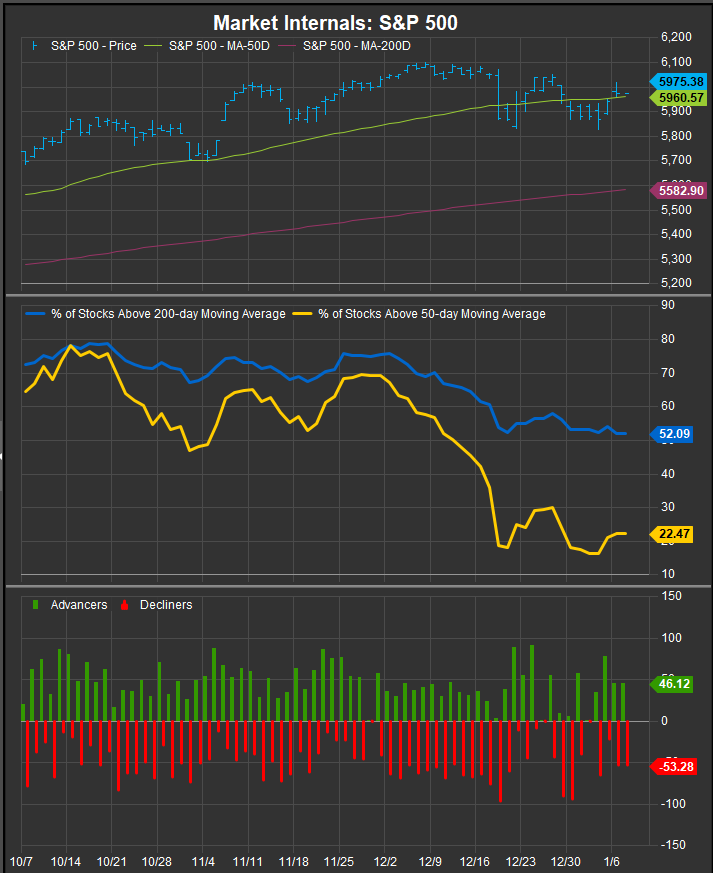
The first Tactical Tuesday Report of 2025 rolls out as investors are looking to accumulate equities on year-end 2024 weakness. The S&P 500 entered 2025 with near-term breadth measures showing signs of potential selling exhaustion as >80% of stocks had seen prices pushed below their respective 50-day moving averages in December (chart below, middle panel). With the S&P price trend still intact, we interpret this setup as a broad accumulation opportunity. Investors seem to agree as they’ve pushed the index price back up above its 50-day moving average to start 2025.
When equities get to potential pivots like this, we typically look at the sector leadership profile and market bellwethers like the SOX (Philadelphia Semiconductor Index) to give us a read on risk appetite. It’s very early, but the 2025 YTD sector performance chart (below) shows the Technology Sector leading out of the gates.

The Early Read: Semiconductors are Acting well as an Accumulation Opportunity
The SOX Index is showing signs of potential bullish reversal, and we want to see that confirmed by broad participation beyond Mega Cap. leadership like NVDA and AVGO. Below we show price action, internal strength and stock level performance for the SOX Index. While early in the bullish reversal process, near-term signs are positive.
SOX Index Price and Relative Performance
The 5400-5500 level is a key threshold. Above that level, bullish reversal is confirmed for the index.
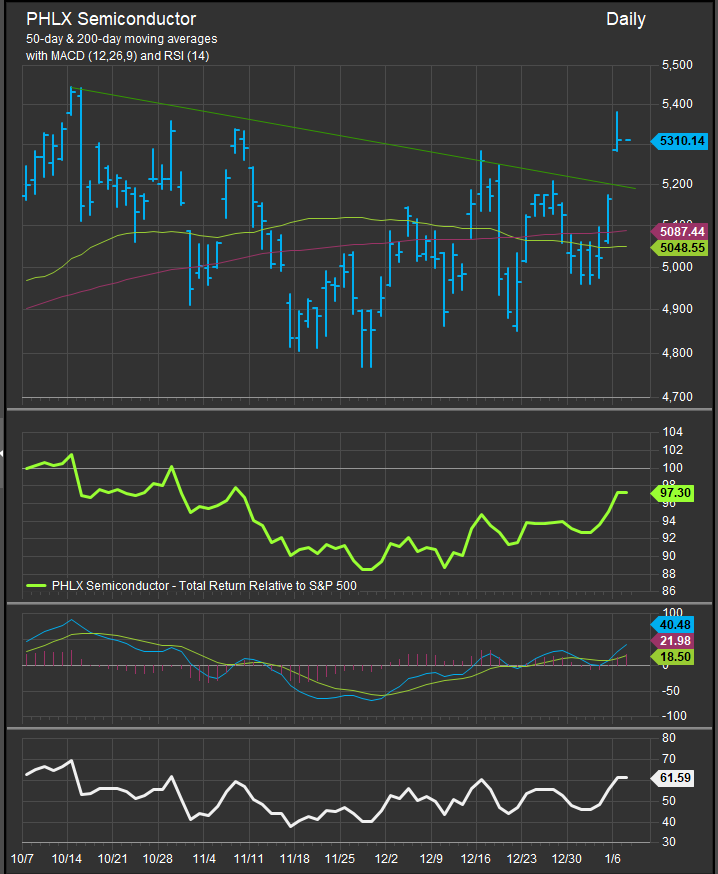
SOX Index Internals
2025 has seen the strongest and broadest bid for Semiconductor stocks since October with >60% of the 31 index constituents having regained their 50-day moving average in the near-term. ON the daily advancers/decliners measure (chart below, bottom panel), we’ve hit 90% upside participation on each of the last 3 trading days.

SOX Index Constituent Ratings and Near-term Performance
Down cap. names in the SOX Index will be key to determining whether buying power is strong enough to sustain another significant uptrend. We highlight 1-month excess returns vs. the S&P 500 in the table below (bolded column) and we are pleased to see several constituents out to double-digit gains above the benchmark.

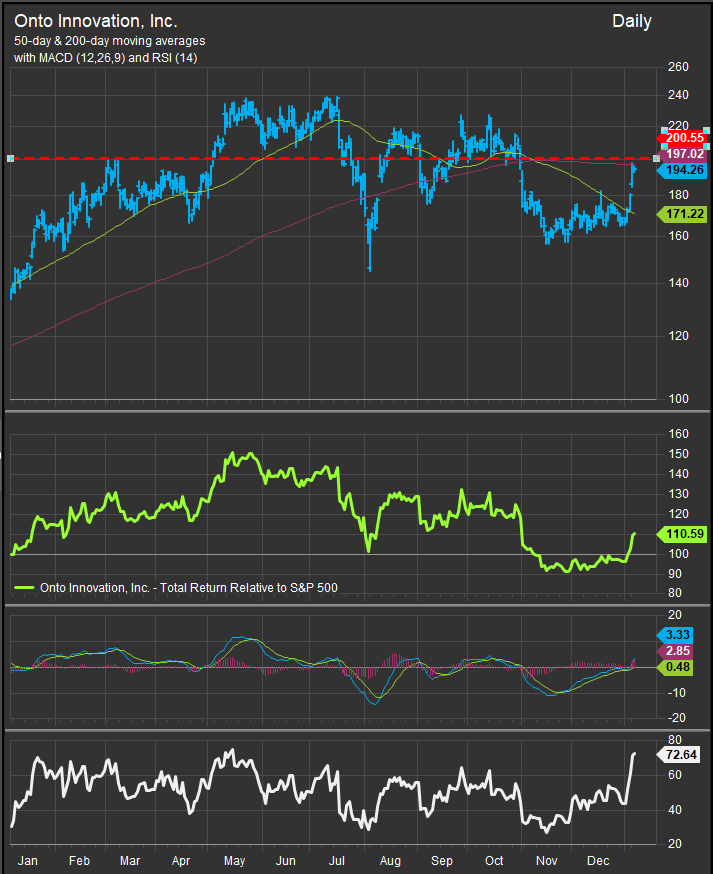
ONTO is an example of a stock that was perceived as a darling prior to August 2024 when Semiconductors began their correction. It is testing overhead resistance at the “neckline” of 2024’s top in prices. Oscillator studies show near-term overbought conditions (chart below, bottom panel) while the MACD study is registering a buy signal (chart below, panel 3). Our process typically interprets extreme overbought conditions as a key ingredient to bullish trend change. With that in mind, we want to see a name like ONTO push higher. That would flip the stock to a “buy” in our work and have us looking to accumulate as the overbought condition cooled.
Conclusion
We start 2025 looking for bullish exposures like Semiconductors to be accumulated. The SOX Index is acting well with increased constituent participation to the upside beyond Mega Cap. leadership. The price action we are seeing strengthens our bullish conviction to maintain long exposure to Semiconductors and other Growth focused areas of the US Equity market.
Data sourced from FactSet Research Systems Inc.
