


April 8, 2025
The S&P 500 has now retraced the entirety of current cycle gains above the S&P 500’s 2022 price high (chart below). As we noted in our weekly piece, the current level represents a 50% retracement of the entire bull market move from the trough in October 2022 through the peak in January 2025. With tariffs a threat to continued economic expansion, it is appropriate that investors have discounted the “soft landing” scenario and have us back at roughly the 3-year mean price for the Index. 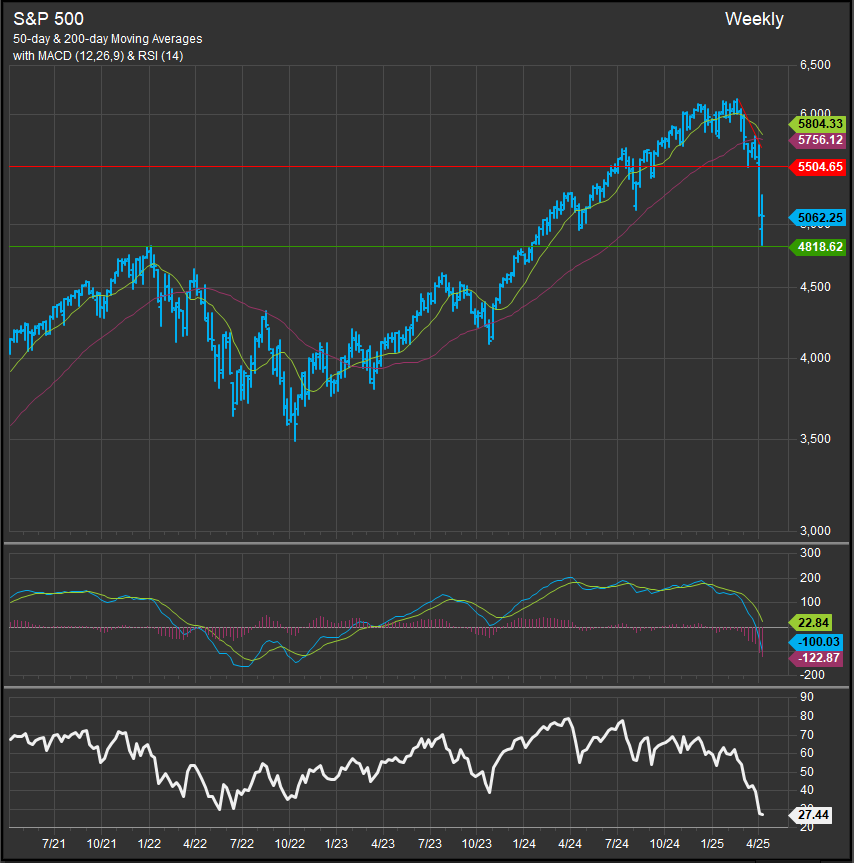
Homebuilders and Housing Related Stocks Potentially Bottoming
Given the significance of the YTD decline in equities and a lot of questions about the endgame surrounding tariff policy we will be relying on our own technical indicators to furnish us with clues about the bottoming process for equities. We are seeing some signs to encourage us as we note homebuilders have begun outperforming since mid-February despite a weak tape. Our chart of the S&P 500 Homebuilders Sub-Industry is below. Note the relative performance vs. the S&P 500. These relative gains come despite weak price action in absolute terms. We think this type of set up is indicative of selling exhaustion and is a sign that speculative buyers have mainly exited homebuilding stocks already.
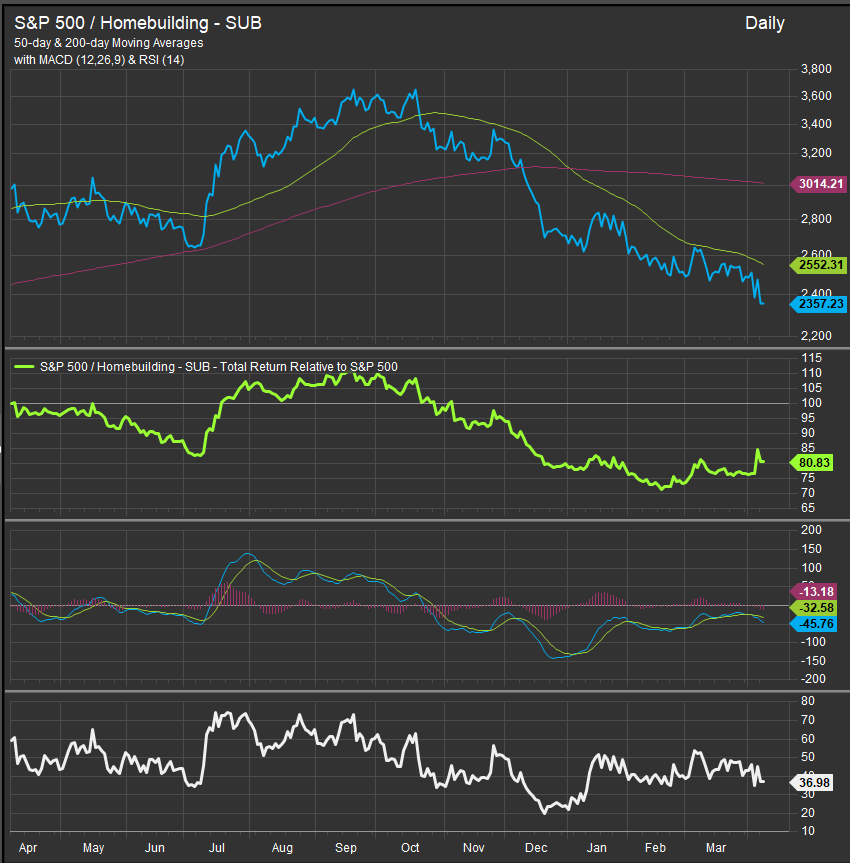
We note similar near-term dynamics among Building Products stocks and Construction Materials co.’s as well. Stocks like VMC, MLM, CSL, BLDR and to a slightly lesser extent big builders like LEN and DHI are seeing performance improve despite price declines.
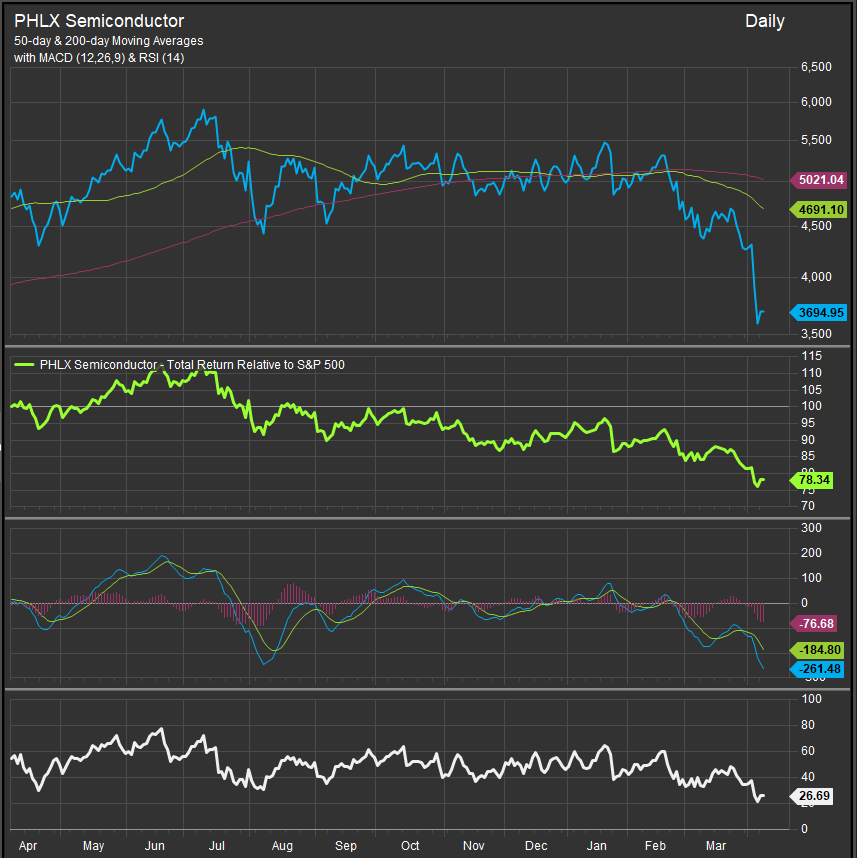
Some Firming in Mag7, but Semiconductors Remain Out of Favor
When we survey our Mag7 cohort, we are seeing similar positive divergence dynamics in MSFT, GOOG/L and TSLA in the near-term. However, we haven’t seen an abatement of selling pressure in NVDA or the SOX Index more broadly (chart below). AAPL, AMZN and META also remain under pressure as of today.
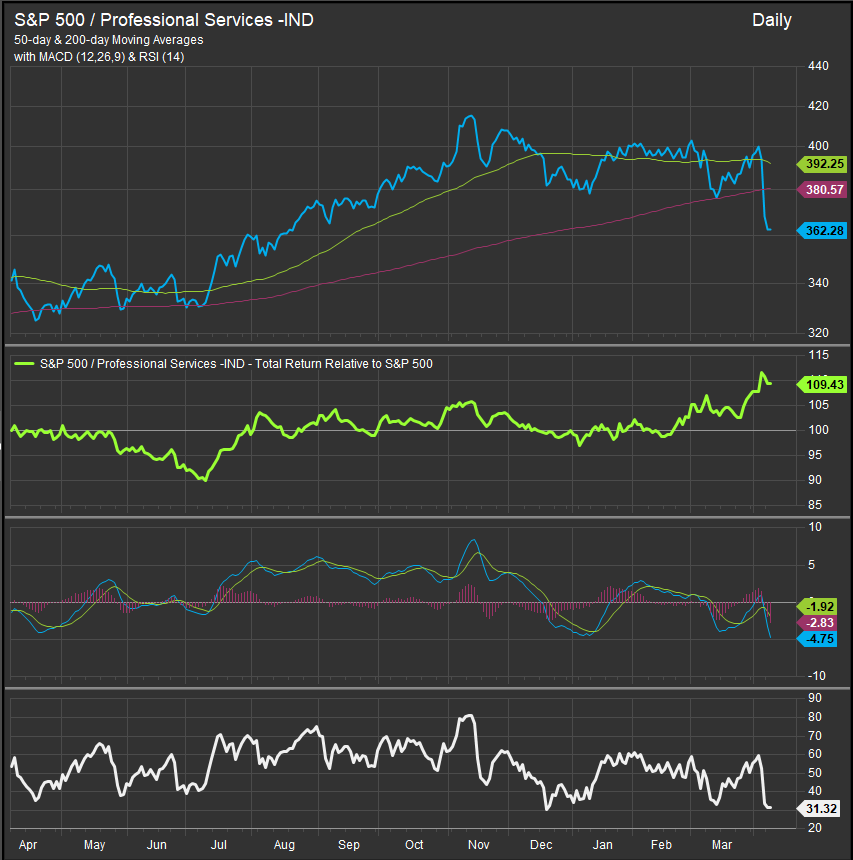
2025 has been tough on equities, but Value and Income stocks have offered Outperformance
Growth stocks offered heroic gains and strong outperformance throughout 2023 and 2024, however that dominance led to a lot of tilted portfolios heading into 2025. With tariffs roiling both the bull case for equities and throwing a wrench in the Fed’s preferred course on interest rate policy, mundane areas of the equity market have gained luster. The S&P 500 Professional Services Industry (chart below) is an example of a group that performs very well when equities face macro/inflationary challenges. Commercial Services, Metals & Mining, Insurance, HC Providers, Mortgage REITs, MLPs and Trading Co.’s are examples of industries that typically add value in turbulent markets along with traditional defensive exposures like Utilities, Pharmaceutical co.’s, and Consumer Staples stocks.
Conclusion
We are seeing some early signs of selling exhaustion around the homebuilding theme and some Mag7 members, but we also want to keep in mind that there are periods (like 2022, 2019, 2010, 2001-2007) where Value outperforms and anonymous companies, we rarely think about lead equities on performance. Tariff pronouncements have complicated the path back to Growth-led expansion, but there are different ways to outperform, and downside alpha capture is no less important to long-term returns. Amidst the earliest signs of selling exhaustion regarding the Growth trade, we want to stay flexible and continue to look for clear messages from the market if we can’t get them from our policy makers.
