March 18, 2025
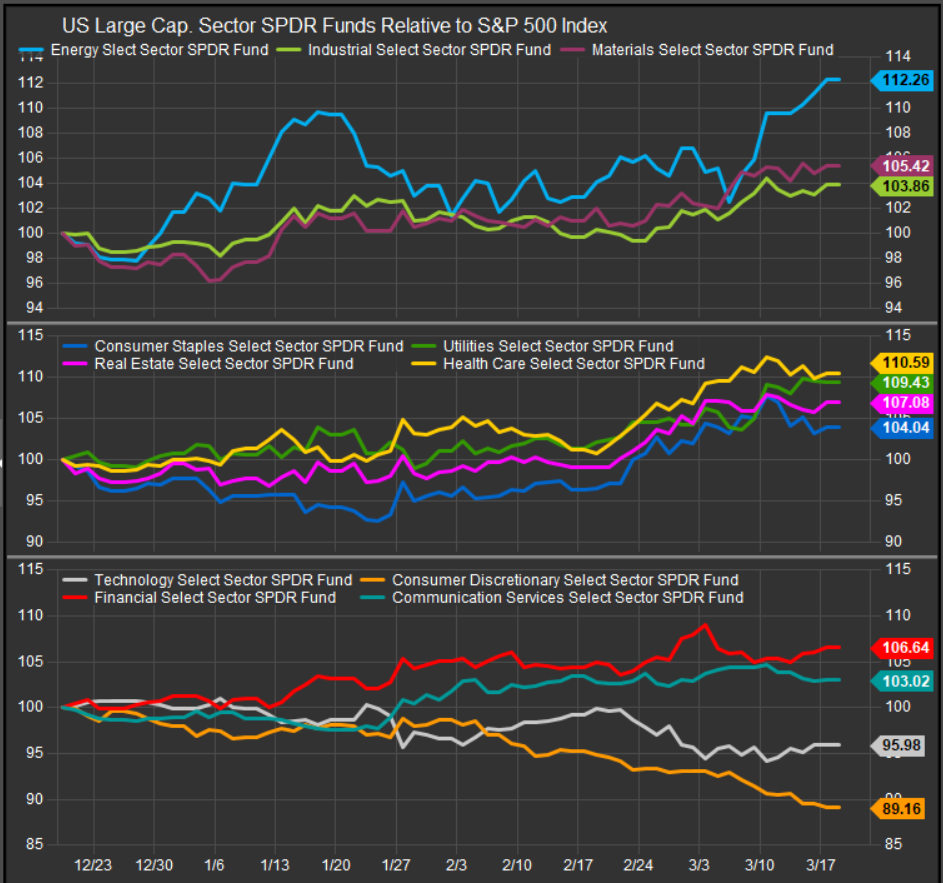
The S&P 500 is attempting a rally with yesterday’s positive close marking the first consecutive positive closes since the current correction began on February 19. Discretionary shares continue to see performance nosedive vs. the S&P 500 while buyers are starting to kick the tires on Tech shares here. The sector performance chart below shows a pause in de-risking as (panel 2) as historically defensive sectors had been the clear preference into last week. Energy shares are now rebounding along with Financials, Materials and Industrials giving the leadership profile a Value tilt.

Market Internal Strength Remains Concerning for the S&P 500
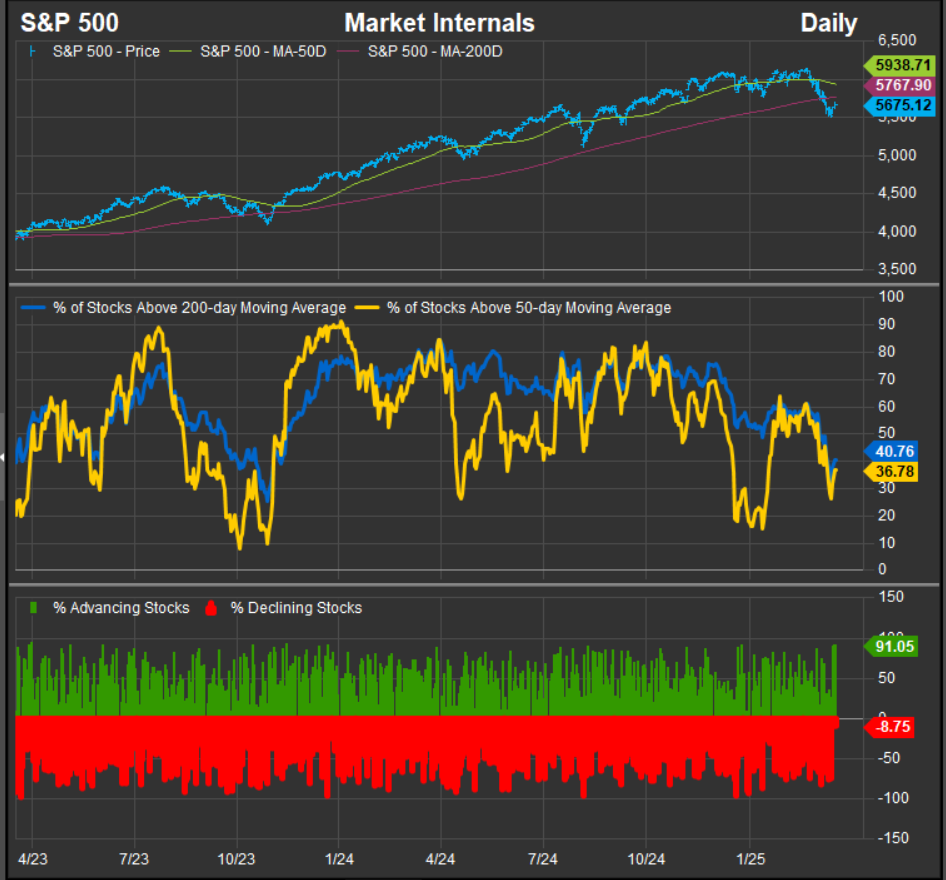
Despite the sound and fury around tariffs, 10% drawdowns are common occurrences and are part of every long-term bull market trend. However, looking at the S&P 500’s internal strength gauges, we are seeing a somewhat concerning picture.
Our standard market internal chart highlights the strength of shorter and longer-term trends, and we typically want to buy near-term weakness as long as the longer-term trend remains strong. But as we see in our chart, both the % of stocks above their 50-day moving average and % of stocks above their 200-day moving average have now dipped below the 50% threshold. That’s a different setup than we’ve had in place for most of 2023-2024. The series has consistently been above the 50% level since early 2023. The only violation was October/November of 2023 when equities washed out on a drawdown of 12% peak to trough. While even that relatively positive scenario projects a deeper decline than we’ve seen in the near-term, the concerning part is that when we look back over the past 10 years, that narrow decline is a bit of an outlier.

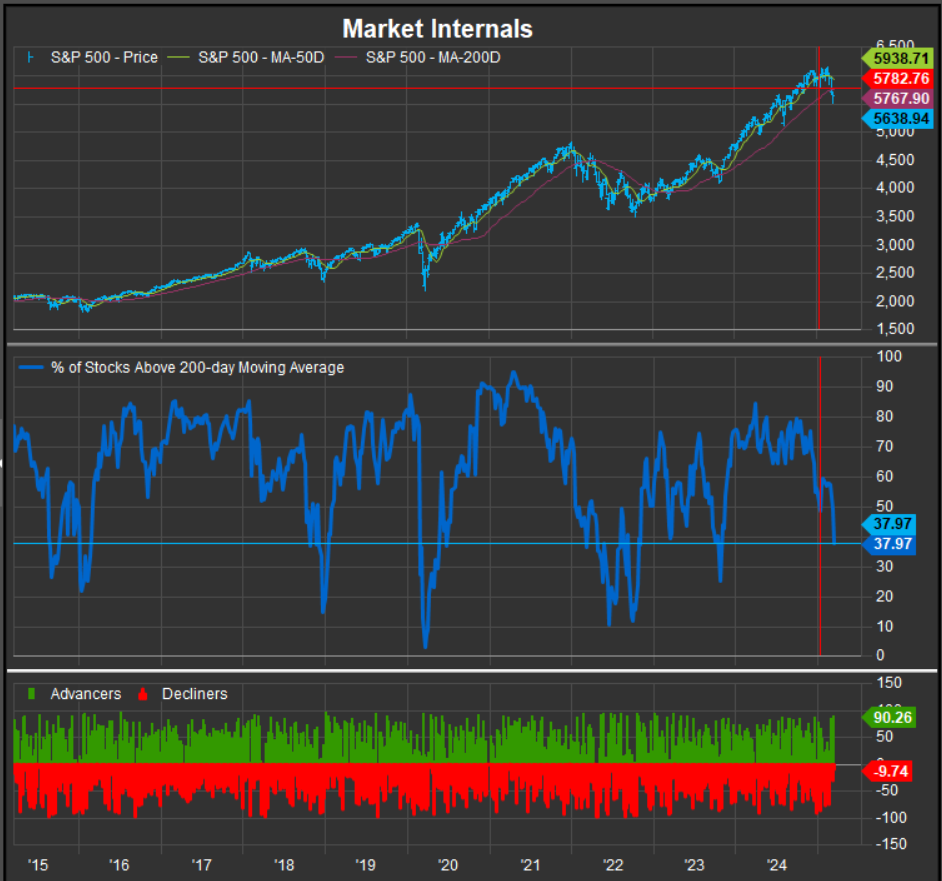
The chart below focuses on the % of S&P 500 constituents above their 200-day moving average over the past 10 years. We can see that the series has moved below today’s levels 7 times over the last 10 years on a weekly basis. Those instances have generally coincided with drawdowns >10% and are a piece of evidence that makes us think the current correction is likely to be deeper. Momentum busts in 2015/16 and in late 2018 were >15% declines while the pandemic drawdown in 2020 and the bear market of 2022 were obviously far steeper.

Conclusion
Tariffs and trade wars are volatile exercises in market intervention. On the one hand, the Trump administration could decide to walk back its more aggressive measures, but what we have in the present is growing investor recognition that much of the good news that has been priced in through 2023-2024 is now at risk. We think a deeper decline is likely without the emergence of a clear bullish catalyst.
