April 22, 2025
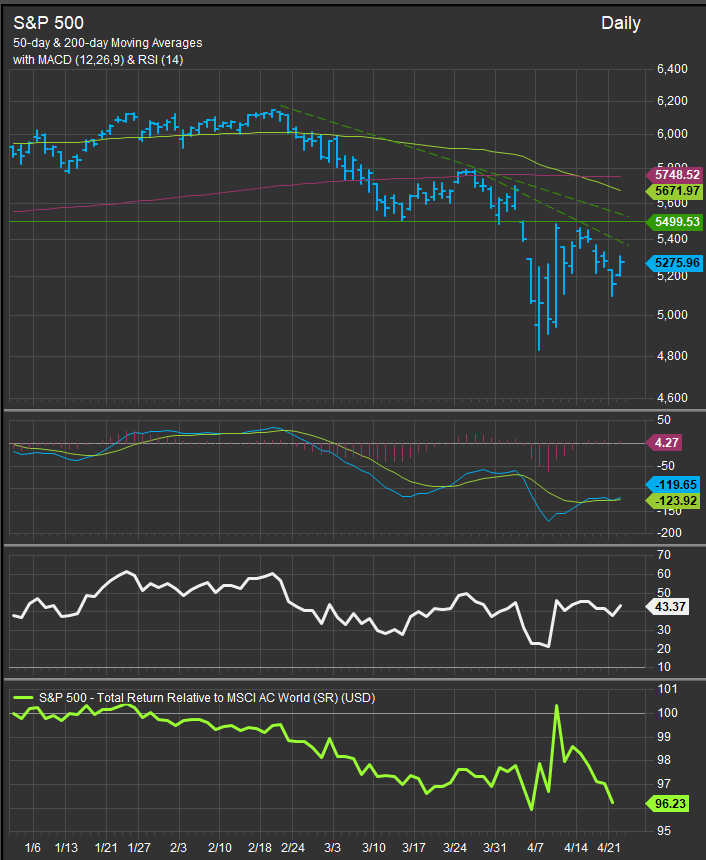
The S&P 500 has pivoted off a significant long-term support level at 4818 which marked the top of the post-pandemic advance for equities (chart below). Price has traded up to the bottom March’s trading range which encompassed 5504 to 5786. We think that zone is the “neckline” for a potential top in the index, but it’s also a key threshold for any developing bullish reversal in the index.
Price Action still Contained by Near-term Downtrend
Today’s price action falls short of a bullish signal as it hasn’t overcome near-term downtrend levels, however the MACD and RSI studies are acting well. The chart below shows the 5500 level is prominent as a pivot point in the YTD price action.
Potential Bullish Capitulation Signal for Equities
As of this writing, there are only 5 declining stocks among S&P 500 constituents. Following two recent days where > 90% of S&P 500 stocks were declining, this is a bullish accumulation pattern that is an ingredient in the formation of durable lows. We will publish more on this in a subsequent note!
Signs of Positive Divergence: TSLA
When technicians like me talk about “positive divergence,” we’re looking for things that should be getting worse, but are getting somewhat better instead. Price action and performance relative to the S&P 500 have now shown positive divergence vs. the S&P 500 since March 10th. The chart of YTD price action (below) shows price support forming at the $217 level.

The correction is maturing towards a tradeable low based on today’s bid. We still think there’s potential for another retest of 4818 on negative news, but if we see upside follow-through above the 5500 level on the S&P 500, that’s a constructive sign from near-term price action. We will continue to monitor developments to gain conviction as equities consolidate.
Data sourced from Factset Research Systems Inc.
