
Our Tactical sector report looks at price action and options market indicators to evaluate potential near-term dislocations in price. The table below covers the large cap. US Sector Fund Families from SPDR’s, iShares and Vanguard.
Over the past month we’ve seen rotation away from min vol. sectors which had dominated the preceding 3 and 6-month timeframes. Energy, Discretionary, Comm. Services and Technology Sectors have taken up leadership over the past month while Industrials and Financials have been the steadiest performers.
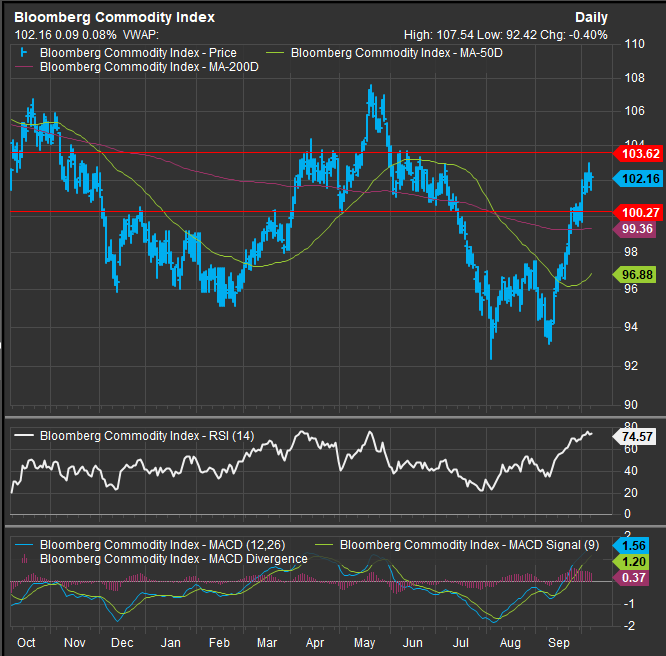
Looking at 3yr and 5yr returns, we see income generating sectors are still structural laggards in the pandemic/post-pandemic cycle. The Energy Sector is bouncing in the near-term after a deep retracement of its 3-year gains left it at deeply oversold levels. We would cue off of commodities prices moving forward and we are looking at the 108 level on the Bloomberg Commodities Index to signal positive trend change for Commodities prices. Currently the Index is at 102 and short of our threshold.
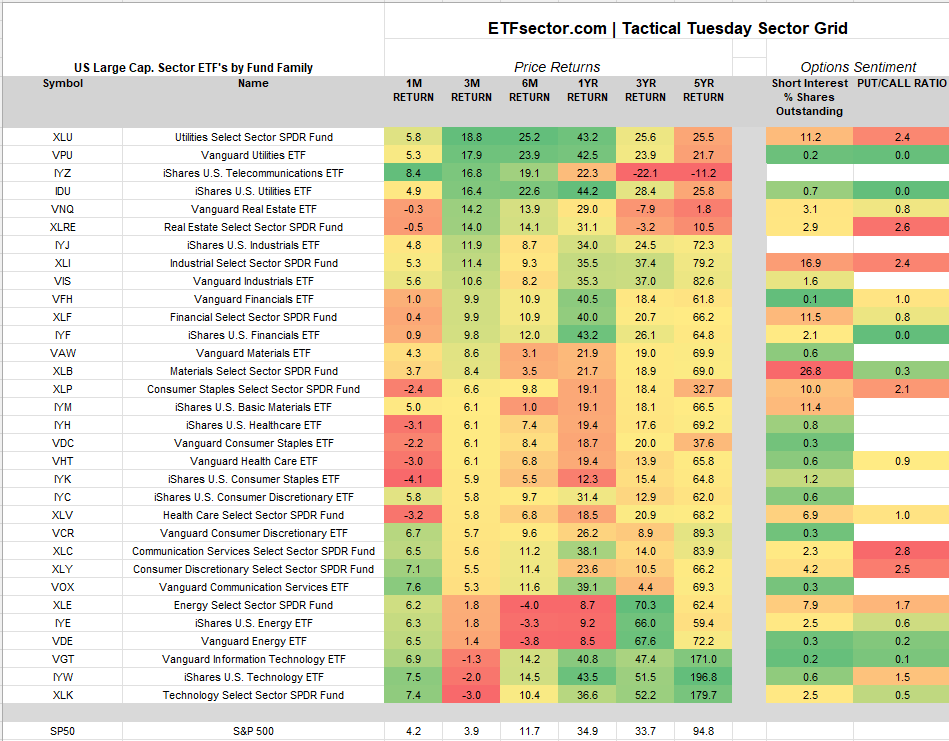
Looking at the options market sentiment readings we see the Materials and Industrials Sectors with the highest percent of short interest to shares outstanding. PUT/CALL Ratios are more evenly distributed. It should be noted the SPDR funds have the most robust options activity ascribed to them in the data.
Over the longer term we continue to favor Technology, Financials, Discretionary and Comm. Services as favored exposures. As mentioned, we are looking at a few key levels around Commodities, Crude and the Energy Sector itself to trigger a tactical position change, but for the moment those gages sit below resistance and at overbought conditions. Still just as likely a fade based on our process.
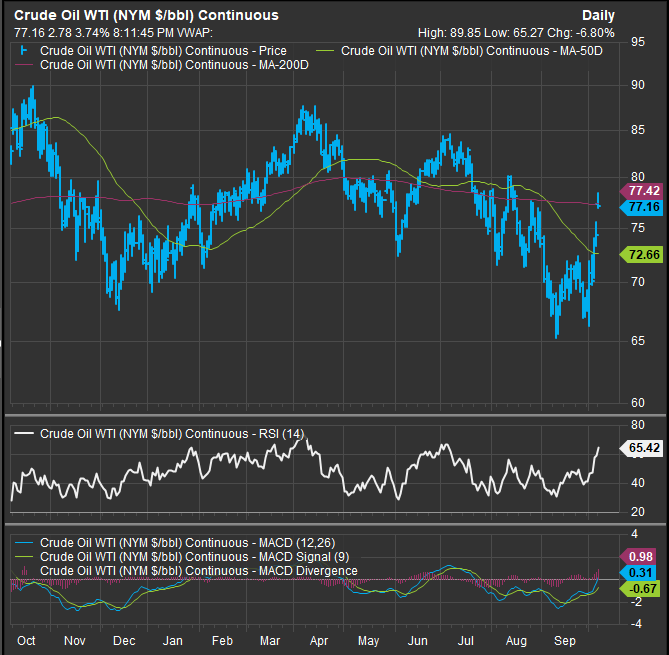
The charts below lay out our key levels on Energy Sector positioning. We will admit at the outset that a deeply oversold asset that is rallying can be a painful situation for our discipline. So, with that as preamble, here are charts of BCOM and WTI Crude with key levels for us.
Bloomberg Commodities Index Throws a Bullish Signal for the Energy Sector above 108
103 is the first bullish “tell” of significance for Commodities prices, but a break-out above the twin peaks of October 2023 and May 2024 would be significant and would project into the 120’s for the index.
WTI Crude gets more interesting above $80 in our work
A move above $80 would trigger an intermediate term buy signal on a target to $95 for Crude.
Data sourced from FactSet Research Systems Inc.
