
TOP3 Model Performance: May 29, 2026 – June 30, 2026
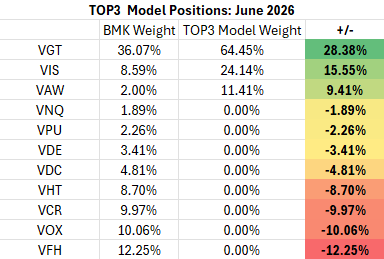
The model’s performance vs. the reference security (VOO) was driven largely by Technology and Industrial sector performance in June. The model gained +176bps in June largely due to the Technology sector’s ability to rebound into month end and finish ahead of the S&P 500 (+48bps). An overweight position in the Industrials sector (VIS, +717bps) helped performance. The model gave back alpha by being underweight low vol. sectors, particularly the Healthcare sector (VHT, + 789bps) which rebounded on strong Pharma and Biotech earnings to lead all sectors in June. It’s VAW position was a mild positive as well leading to a strong month and continued YTD outperformance.
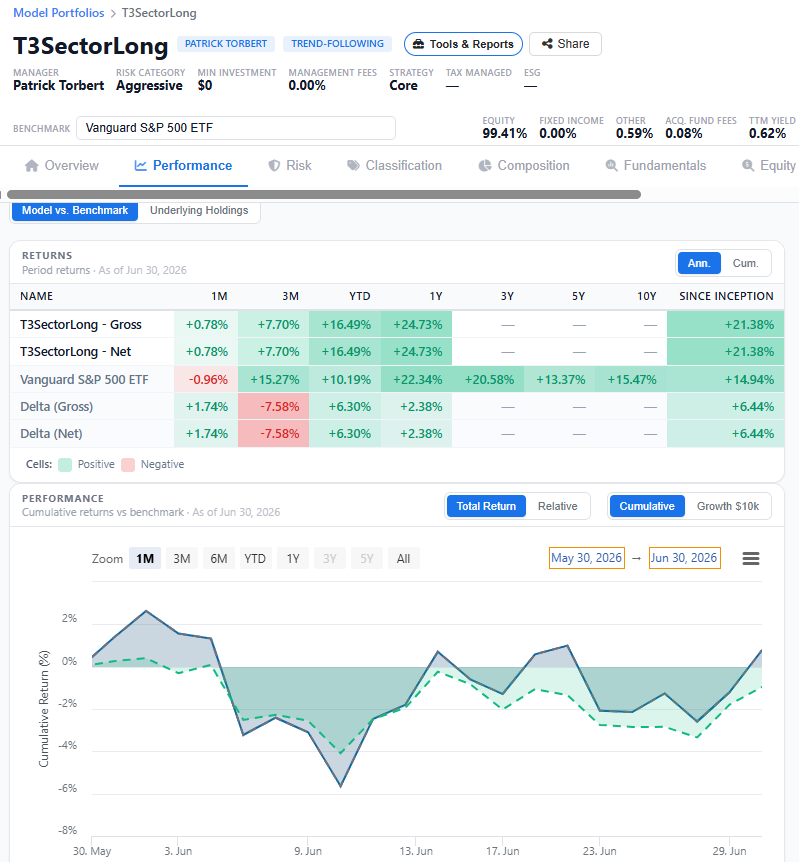
Longer-term Performance
Top3 has generally done a good job adding downside alpha capture since its inception in September of 2024. 2026 has been a strong year for the concept as the model has added value on both the upside and the downside given some big sector level performance concentrations in 2026. Over the past 2-months the model’s ability to allocate large positions to VGT and VIS has helped it outperform the VOO during the recent reflation to new all-time highs. Top3 is outperforming the VOO by +492bps since May 1st.
Conclusion
With geopolitical dynamics fading as the market’s motive force, we’re seeing investors discounting a continued business cycle expansion and a more hawkish Fed policy to go along with it. This likely keeps the momentum/AI trade somewhat restrained. We’d expect continued broadening of upside participation at the sector level, but with a clear understanding that bullish AI news and AI-driven profitability will continue to be momentum triggers. The Top3 model enters July with a barbell of Technology and Low vol. (Real Estate, Healthcare) sector exposure.
About TOP3
We introduced the TOP3 Sector Rotation Model in May of 2024. Here’s a look under the hood at the inputs we use to score the 11 GICS Sectors and our resulting positions. The model includes up to 14 indicators that range from:
- Stock Level Technical Characteristics
- Macro-overlays:
- equity trend (S&P 500)
- interest rate trend (10yr US Treasury Yield)
- commodities trend (Bloomberg Commodities Index)
- USD trend (vs. EUR & Broad Currency Indices)
- Relative performance vs. the benchmark S&P 500
- Overbought/Oversold oscillator studies
We are currently using the Vanguard family of sector funds (VDE, VAW, VIS, VCR, VDC, VHT, VFH, VGT, VOX, VPU, VNQ). We select 3 out of 11 Sectors each month and have no exposure to the 8 sectors with the lowest scores in our model.
Data from Factset Research Systems Inc.
Disclaimer: This material is for informational and educational purposes only and should not be considered investment advice, a recommendation, or a solicitation to buy or sell any ETF, security, country exposure, or investment strategy. Country ETF flows and performance can change quickly and may reflect short-term positioning rather than durable investor conviction. International investing involves currency, geopolitical, liquidity, regulatory, and macroeconomic risks. Past performance is not indicative of future results. Investors should consider objectives, risk tolerance, liquidity needs, and consult a qualified financial professional before making investment decisions.
