

TOP3 Model Input Scores: August 2026
The table below shows the TOP3 model’s scores for August. Financials have moved into the top position, while Information Technology and Industrials tie for second and occupy the final two portfolio slots. The result is a decisive shift toward cyclical leadership after July’s combination of Technology, Real Estate and Health Care. Real Estate ranks fourth and remains constructive, while Utilities and Communication Services share the weakest score.
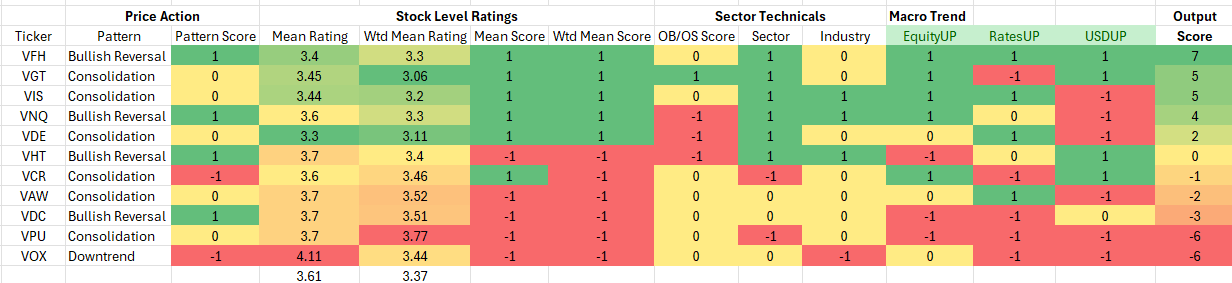
Key: Pattern = L/T (1yr+) Price Pattern of the Sector ETF, Mean Rating = simple average of 1-6 ratings (buy to sell) of all stocks within the sector, WTD Mean Rating = Cap Weighted Sector Constituent rating, OB = Overbought, OS = Oversold, N = Neutral
Model Input Commentary
The model inputs favor Financials, Information Technology and Industrials for August. Financials combine a bullish reversal pattern with positive stock-level, sector and macro confirmation, producing the strongest composite score. Technology retains strong stock-level and sector support, but consolidation and a negative rates input temper the signal. Industrials match Technology’s score as positive stock-level ratings, sector and industry trends and a favorable rates input offset a stronger-dollar headwind. Real Estate is the first sector outside the portfolio despite a bullish reversal profile. Energy remains positive but below the selection threshold, while Health Care loses its July allocation as weak stock-level ratings and equity confirmation offset its reversal pattern. Utilities and Communication Services tie for the weakest score.
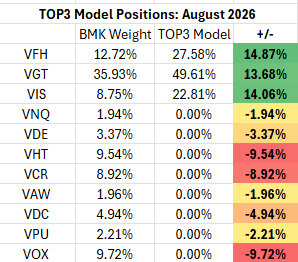
TOP3 Sector Rotation Model Portfolio: August Positioning vs. Benchmark Simulated S&P 500 (data as of 7/31/2026)
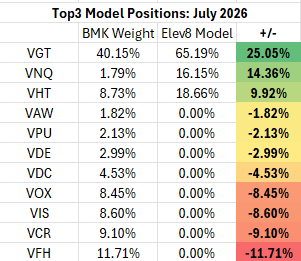
Previous Month Model Signal: July 2026
The August portfolio is concentrated in Information Technology, Financials and Industrials. Technology remains the largest position at 49.61%, while Financials rises to 27.58% and Industrials receives 22.81%. The three active overweights are similar in size: Financials +14.87 percentage points, Industrials +14.06 and Technology +13.68. Real Estate and Health Care, both selected in July, return to zero weight, and the portfolio has no exposure to the other six sectors below the cutoff.
Conclusion
The TOP3 model enters August with a more cyclical and more concentrated posture than it carried in July. Financials and Industrials broaden the leadership mix beyond Technology, but the portfolio remains highly sensitive to the earnings and price behavior of its three selected sectors, particularly the nearly 50% Technology weight. The shift away from Real Estate and Health Care reduces defensive and rate-sensitive exposure, while the absence of Energy means the portfolio is not using the sector as an inflation or geopolitical hedge. We think the signal remains constructive for August, but confirmation should come from sustained Financials and Industrials strength alongside renewed stability in Technology.
Model and Presentation Data through July 30, 2026
Disclaimer: This material is for informational and educational purposes only and does not constitute investment advice, an offer to sell or a solicitation to purchase any security. Macro and sector relationships can change rapidly. Past performance does not guarantee future results.
About TOP3
We introduced the TOP3 Sector Rotation Model in July of 2024. Here is a look under the hood at the inputs we use to score the 11 GICS Sectors and our resulting positions. The model includes up to 14 indicators that range from:
- Stock Level Technical Characteristics
- Macro-overlays:
o equity trend (S&P 500)
o interest rate trend (10yr US Treasury Yield)
o commodities trend (Bloomberg Commodities Index)
o USD trend (vs. EUR & Broad Currency Indices)
- Relative performance vs. the benchmark S&P 500
- Overbought/Oversold oscillator studies
We currently use the Vanguard sector fund family to express our model positions. We select the three highest-scoring sectors each month and have no exposure to the eight sectors below the portfolio cutoff.
Data from FactSet Research Systems Inc.
