



Note: In an effort to use and talk about more sector products, we are expressing our models with Vanguard sector funds this month.
TOP3 Model Input Scores: June 2026
The table below shows the TOP3 model’s scores for June. Technology remains the top-rated sector idea. While the natural resources exposures have de-rated over the past 2-months, their intermediate-term technical profiles are more attractive than low vol. sector exposures which make up the bottom of our scorecard.
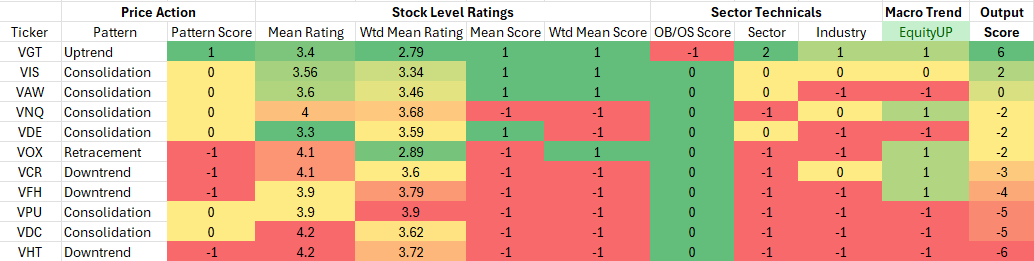
Key: Pattern = L/T (1yr+) Price Pattern of the Sector ETF, Mean Rating = simple average of 1-6 ratings (buyàsell) of all stocks within the sector, WTD Mean Rating = Cap Weighted Sector Constituent rating, OB = Overbought, OS = Oversold, N=Neutral, Vanguard Sector Tickers – VGT – Tech – VIS – Industrials, VAW – Materials, VNQ – Real Estate, VDE – Energy, VOX – Communications, VCR – Cons Discretionary, VPU – Utilities, VFH – Financials, VDC – Consumer Staples, VHT – Healthcare
Model Input Commentary
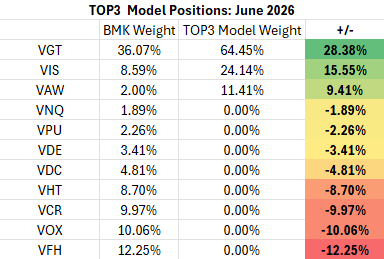
The Top3 Model went into May positioned for Technology sector momentum but hedged for a potential rebound in the Energy trade. The former was prescient; the latter didn’t materialize. May’s big developments revolved around continued sharp rotation back into AI infrastructure exposures with a heavy concentration of Technology Sector buying. The S&P 500 closes the month of May at or near all-time highs. The model’s macro inputs acknowledge the equity bull market as a motivating trend. We maintain positions in Discretionary, Comm. Services and a partial position in Financials on the potential that Tech strength and war resolution will benefit economically sensitive cyclicals over recession plays. Commodities, interest rate and USD trends have largely been sideways over the past 3-months. Progress on a US/Iran deal could continue to put downward pressure on Crude prices, but we suspect those effects will be balanced out by AI energy demand effects and the potential for the business cycle to continue expanding around the AI trade. We also note that while the Energy sector is not oversold by our model’s threshold, Energy stocks have seen heavy selling in the near-term and are setup for a bounce.
TOP3 Sector Rotation Model Portfolio: June Positioning vs. Benchmark Simulated S&P 500 (data as of 5/28/2026)
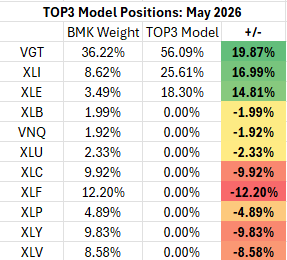
Previous Positioning as of last Rebalance: April 28, 2026
Performance vs. S&P 500 (VOO) BMK, May 2026
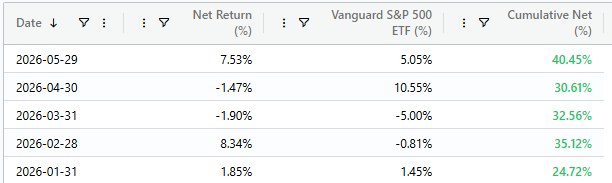
TOP3 rebounded in May after being on the wrong side of the market in April. A continued long position in Energy was a drag on performance, but the model gained approximately 250bps vs. the S&P 500 by means of its near 20% overweight to the Technology sector.
Conclusion
June will be a test for the trend-following model’s efficacy. A recessionary correction would force us to cover before our next scheduled rebalance at the end of the month. We’re aligned with an inflationary bull market regime continuing through June. Tech Sector momentum is the dominant force motivating equity investors and we aren’t seeing any obvious headwinds as the month changes. We remain more hedged for inflation than recession. Weak eco data or earnings previews would be the most likely negative catalysts at present.
About TOP3
We introduced the TOP3 Sector Rotation Model in June of 2024. Here’s a look under the hood at the inputs we use to score the 11 GICS Sectors and our resulting positions. The model includes up to 14 indicators that range from:
- Stock Level Technical Characteristics
- Macro-overlays:
- equity trend (S&P 500)
- interest rate trend (10yr US Treasury Yield)
- commodities trend (Bloomberg Commodities Index)
- USD trend (vs. EUR & Broad Currency Indices)
- Relative performance vs. the benchmark S&P 500
- Overbought/Oversold oscillator studies
We use the largest passive sector-based ETF by AUM ($) for each sector as our proxy for TOP3 sector positions. We select 3 out of 11 Sectors each month and have no exposure to the 8 sectors with the lowest scores in our model.
