March 2, 2026
TOP3 Model Input Scores: March 2026
The table below shows the TOP3 model’s scores for March. February’s big developments included a renewed concern over tariffs after the US Supreme Court struck down the Trump Administration’s previous policy. Military action against Iran has become a topic of market focus as well. All of this came against a backdrop of softer economic data and another relatively cool CPI print. What was different is the confluence of events offered a hint of a potential slowdown and interest rates moving lower. Despite the fact that lower vol. sectors improved in the model’s ranking methodology, Commodities Sectors were again the allocation selection for the model in March. Energy, Materials and Industrials share our allocation again for March 2026.
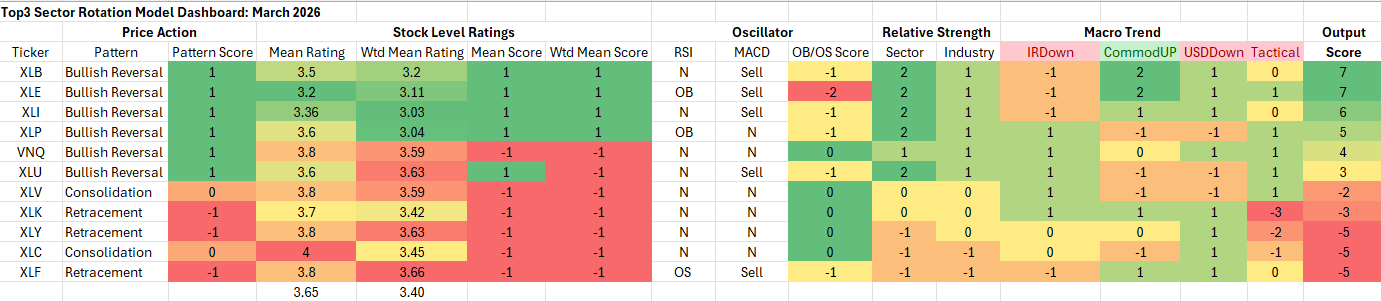
Key: Pattern = L/T (1yr+) Price Pattern of the Sector ETF, Mean Rating = simple average of 1-6 ratings (buy-sell) of all stocks within the sector, WTD Mean Rating = Cap Weighted Sector Constituent rating, OB = Overbought, OS = Oversold, N=Neutral
Model Input Commentary
A tactical overlay remains in place as geopolitics, falling rates and rotation out of the broader AI complex has us concerned about an elevated chance of correction for equities. We think if that were to happen lower vol. securities, precious metals and other haven plays would be clear beneficiaries. The S&P 500 remains within a few percentage points of all-time highs, but our technical and macro inputs are showing pre-cursors to weakness. From the technical side, momentum has been diverging negatively against the S&P 500 uptrend since May of 2025. Narrowing GDP prints, rising consumer delinquencies, pressure on credit in the private equity space and concern over AI disruption are a few of the potential negative catalysts. Mixed with the above geopolitical concerns, we see reason to tilt the portfolio away from the Growth exposures that have been anchoring this bull market since early 2023. The Top3 methodology has us continuing to favor Industrials and Commodity Sectors. The unfolding US conflict with Iran is likely to be a tailwind to the Energy sector in the near-term.
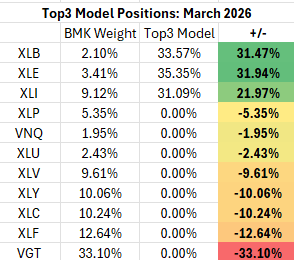
TOP3 Sector Rotation Model Portfolio: March Positioning vs. Benchmark Simulated S&P 500 (data as of 2/26/2026)
Previous Positioning as of last Rebalance: January 31, 2026
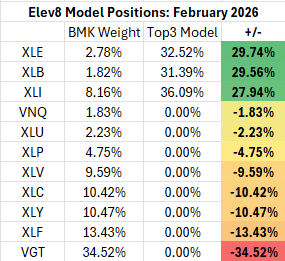
February’s allocation was similar as a strong technical bullish reversal in Energy and Materials sectors through January generated strong bullish readings in our positioning inputs.
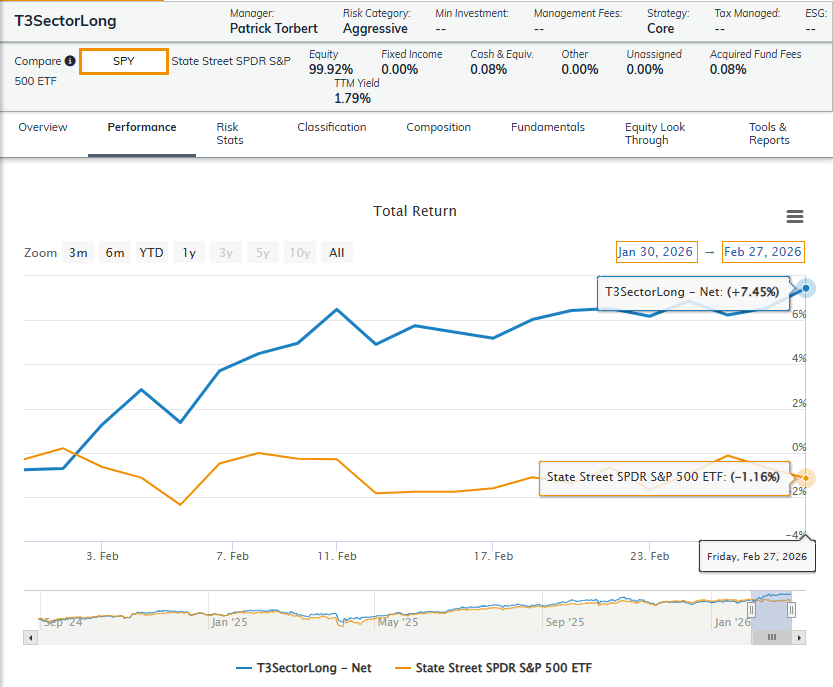
Performance vs. S&P 500 Simulated BMK, February 2026
Conclusion
We’ve seen some concern building underneath the surface of the S&P 500 in 2026. However, the S&P 500 enters March very close to its all-time highs. We think there’s potential for a deeper shake-out in absolute terms. However, the near-term buyer interest in Energy, Materials and Industrials stocks has our model continuing to allocate to all 3 in March.
About TOP3
We introduced the TOP3 Sector Rotation Model in May of 2024. Here’s a look under the hood at the inputs we use to score the 11 GICS Sectors and our resulting positions. The model includes up to 14 indicators that range from:
- Stock Level Technical Characteristics
- Macro-overlays:
- equity trend (S&P 500)
- interest rate trend (10yr US Treasury Yield)
- commodities trend (Bloomberg Commodities Index)
- USD trend (vs. EUR & Broad Currency Indices)
- Relative performance vs. the benchmark S&P 500
- Overbought/Oversold oscillator studies
We use the largest passive sector-based ETF by AUM ($) for each sector as our proxy for TOP3 sector positions. We select 3 out of 11 Sectors each month and have no exposure to the 8 sectors with the lowest scores in our model.
Data from Factset Research Systems Inc.
