
The Consumer Discretionary Sector has shown aggregate technical improvement at the sector level. XLY registered as a long position in our Elev8 Sector Rotation Model at the end of June, 2024 (ETFsector XLY July Outlook) and has since generated several bullish confirmation signals in our process. We will be providing trading signal updates and analysis moving forward in hopes of providing insight into how we identify and build conviction in our bullish portfolio positions and help you do the same for yours!
Inputs to our Elev8 Model started turning bullish in June
Referring to the XLY daily chart below, on June 5th, the MACD gauge, one of our tactical trend studies registered a tactical buy signal. On June 17th, price made a new near-term high which changed the chart price pattern from a consolidation to a bullish reversal which is buy signal in our process. On June 26th the XLY’s relative curve made a new intermediate-term high vs. the S&P 500 which triggered a 3rd buy signal input in our model and on July 2nd price confirmed the near-term bullish reversal with a break-out above intermediate-term resistance at the $186 level which generates an intermediate-term price objective for the XLY at $204. July 2nd also saw the RSI oscillator make a new 3-month high dispelling any potential negative momentum divergence for the time being. In sum, 4 of our 6 price and performance derived inputs are clearly bullish. When compared to the other 11 GICS Sectors, this view in isolation rates Discretionary as the 3rd most attractive Sector SPDR behind only XLK and XLC.

- XLY daily, April 1, 2024 – July 9, 2024
- June 5th: MACD buy signal generated
- June 17th: Price closes above the $180 level forming a “bullish reversal” pattern
- June 26th: Relative Strengh Curve confirms bullish reversal
- July 2nd: Price takes out intermediate-term resistance projecting upside to $204
Breadth Indicators are still flashing caution for XLY
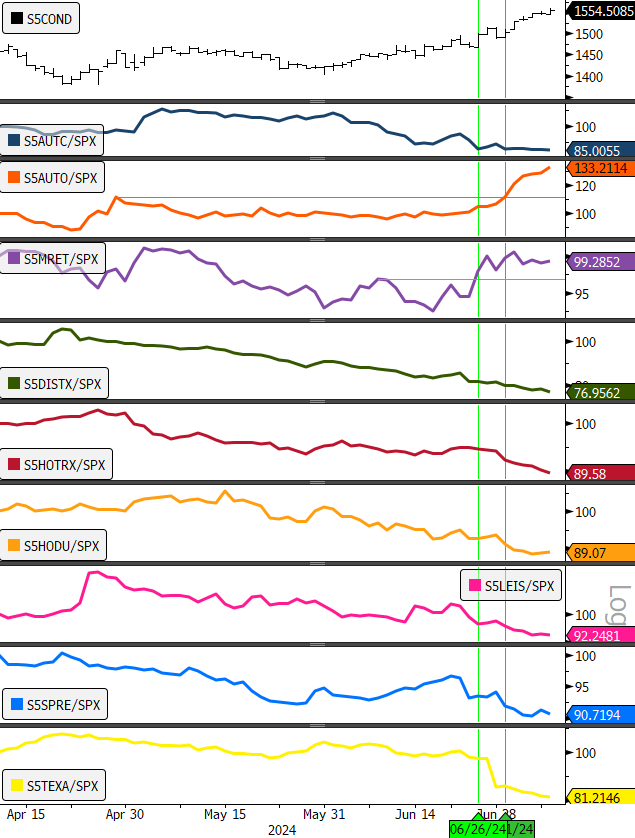
As has been the story for most of this bull market, the one area that continuously falls short of generating bullish trading signals have been our market breadth gages. These measures have improved over the past month as well but fall short of generating outright “buy” signals in our model. However, there was some improvement as TSLA and AMZN spurred bullish reversals on the relative curves of the GICS Automobile Industry and the GICS Multiline Retail Industry respectively. GICS Industry level relative performance trends are an input in the elevate model and are a complement to traditional breadth measures like advance/decline lines and % of stocks above x-day moving averages. Below is a chart of XLY with the 9 GICS Industries that currently comprise the sector. Seven of nine Industries remain in downtrends, but bullish reversals in two of them represent an improvement, and relative to the other GICS sectors they were a positive differentiator when we made our allocation selections for July.
- XLY daily, April 9, 2024 – July 9, 2024
- June 26th: S&P 500 Automobile Industry triggers a “bullish reversal” signal
- July 1st: S&P 500 Multiline Retail Industry triggers a “bullish reversal” signal
- Breadth remains narrow and a concern for the sustainability of the longer-term bull market
With outperformance confined to a very narrow subsection of the S&P 500, the industries that do manifest bullish reversal are worth paying attention to. One way the Elev8 sector model accounts for these market-level problems is by making sure to compare these indicators across sectors rather than having just an absolute level to trigger an indicator. We backed into our long in the XLY this month because although our signals at the end of June weren’t robustly bullish, they were strong compared with most of the other sectors. XLK and XLC were the obvious exceptions, but outside of those two, it’s been a race between flawed competitors and our model gives us some helpful ways to differentiate in this environment.
Sources: Bloomberg
