
For most of the current bull market expansion from early 2023 to present the USD has been range bound, and its directional trend has been sideways. This has sidelined it as an input to our Elev8 Trend model as the primary pattern for the currency was sideways. That may be changing as USD has been animated higher against major crosses by the advent of dovish interest rate policy.
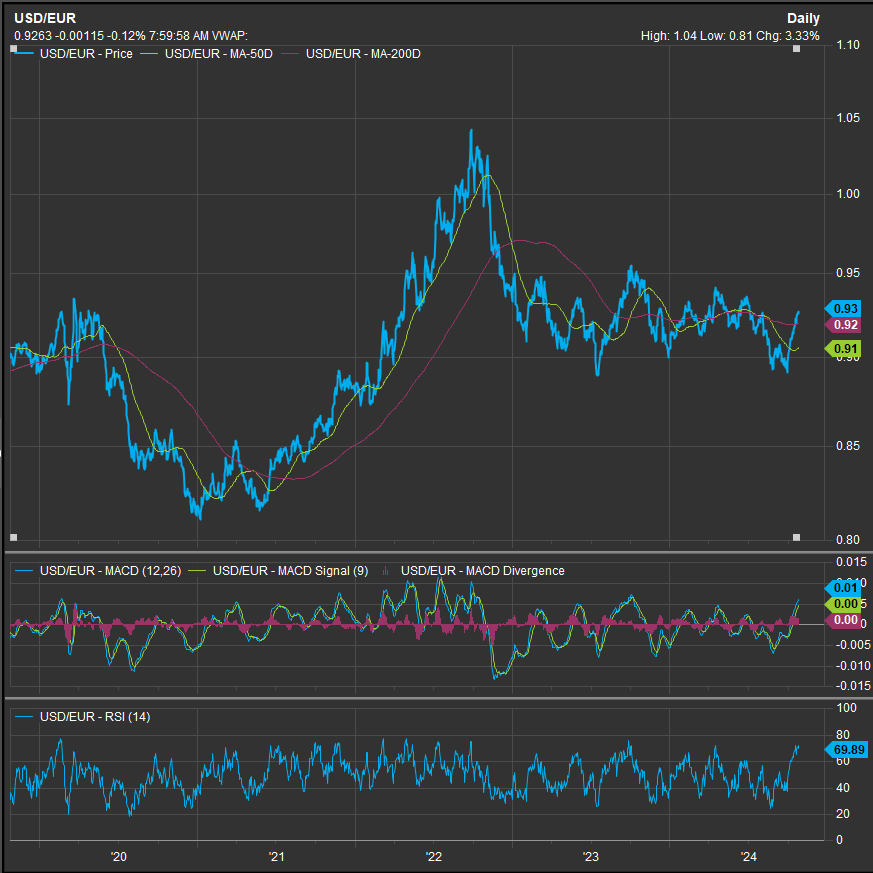
A quick chart review of some of the major currency crosses tells the story. Below is USD:EUR. We can see the sharp near-term rally has the MACD and RSI oscillators at their highest readings since July of 2023, the last time USD was looking frisky to the upside. The 0.95 level is significant as an upside violation would signal long-term bullish reversal for USD.
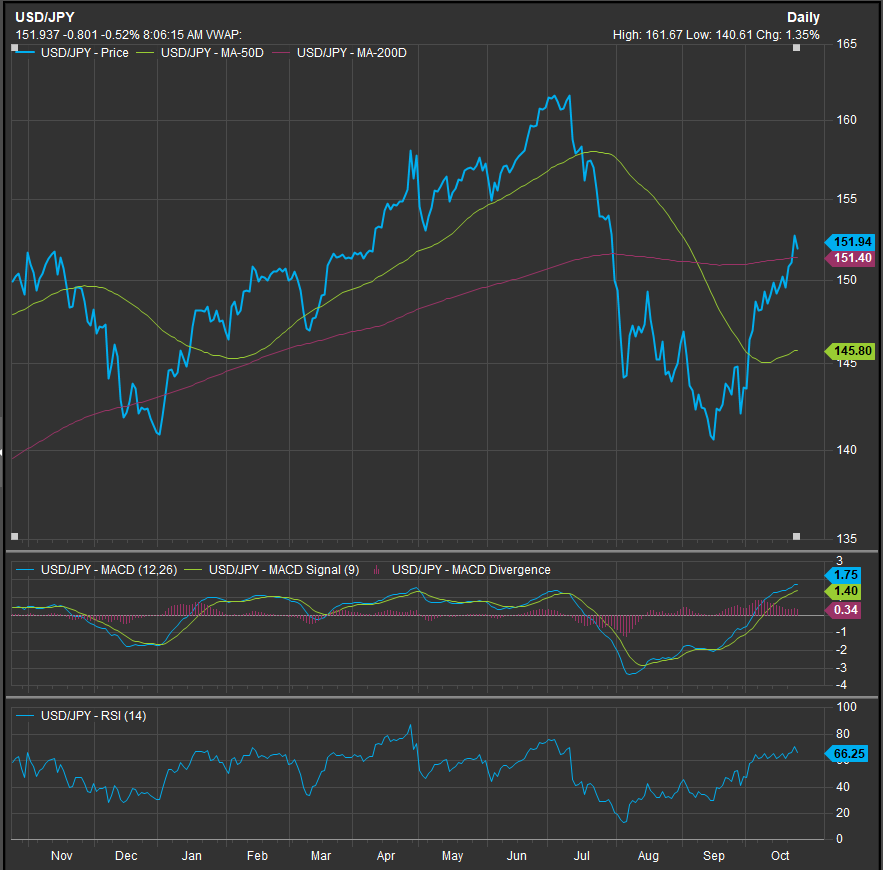
USD:JPY (Chart below) is rallying as well and is worth monitoring as it has reached near-term resistance between 151-152. The 5-year chart of USD:JPY had been in an uptrend favoring USD. Over the summer that trend looked like it might have been topping out, but the “Soft Landing/No Landing” consensus spurred by the Fed’s dovish intervention has changed the forward calculus for investors.
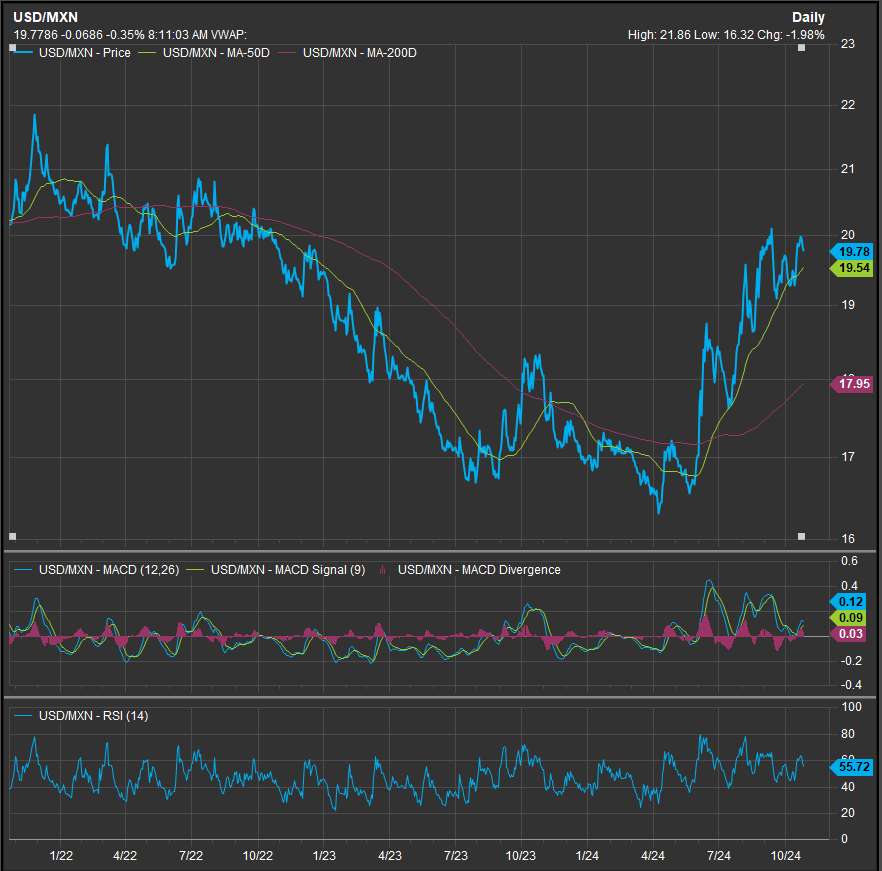
Further highlighting the potential pivot for USD is USD:MXN which is charted below. The 20-21 level sets up as key resistance to the near-term rally in USD going on since April.
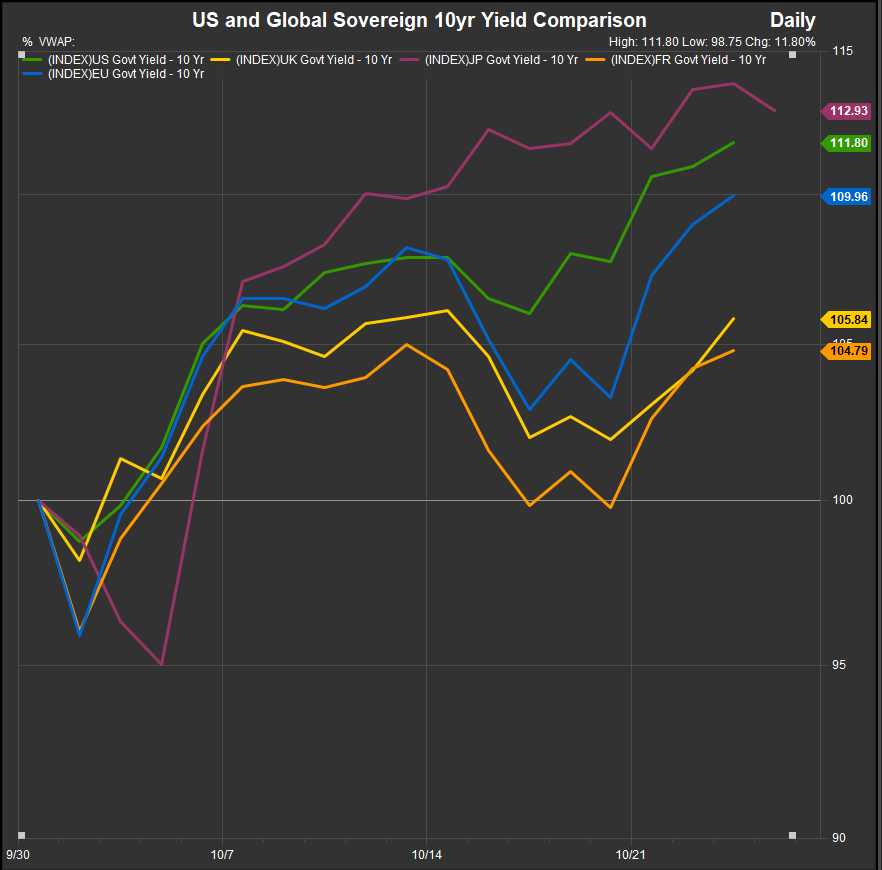
At the risk of oversimplifying, currency valuation is typically motivated by a few fundamental factors that include purchasing power parity, forward inflation expectations and interest rate differentials. It is this latter category that seems to be motivating the recent rally in USD. The chart below shows Major Developed Market Sovereign Yields since September 30th. US Yields have outpaced Eurozone counterparts. Japanese Yields have actually moved up quicker than US, but that historically is an unsettlind development for the Japanese government and can be a drag on the currency.
What are the Implications for US Sector Performance?
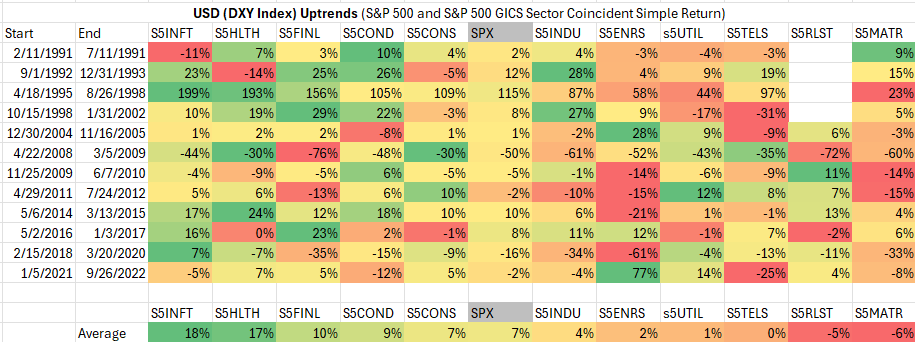
We’ve identified and studied USD trends and sector performance over the past 30 years to come up with a sector-based playbook for rising and falling USD. The table of USD uptrends below is organized by average sector coincident excess return vs. the benchmark S&P 500 during previously ID’d USD uptrends. Typically these trends last at least 6-months and sometimes significantly longer. The last time USD outperfromed in a sustained way was during the inflationary bear market of 2022, and historically the Index performs better when USD is falling rather than rising. Browsing the table below, we see Info Tech, Healthcare and Financials as the 3 top performers in USD uptrends. Commodities Sectors generally lag in rising USD environments, while Utilities, Real Estate and Telecom have also historically lagged.
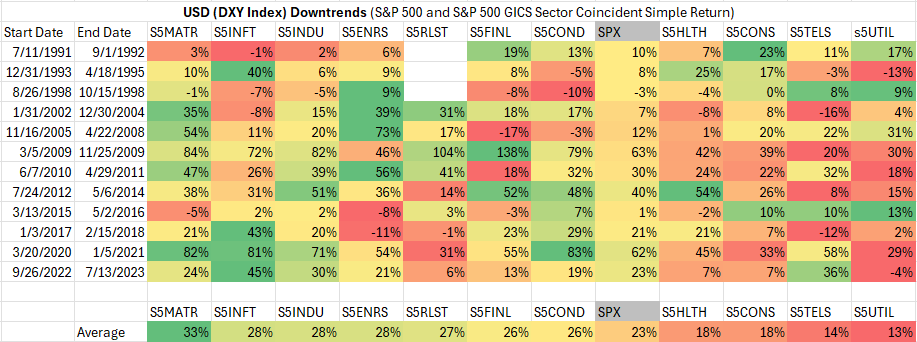
We are also setup for potential mean-reversion in USD cross rates considering the rallies we are pointing out are generally overbought in the near-term and coming into resistance levels on their respective charts. The table below covers USD downtrends from 1991 to present. Historically a falling USD has coincided with a cyclical leadership profile. As we mentioned above, the broad market typically appreciates more with a falling USD as the average coincident gain is 23% when USD is in a downtrend vs. 7% when USD is in an uptrend.
Conclusion
With many recognizing potential pivots for the market including the upcoming US Presidential Election, a fraught situation from a geo/political lens and uncertainty surrounding earnings in the “Soft Landing” scenario, interest rates and currencies are moving higher near-term. We are short of trend change, but paying close attention. Currently we are expecting US rates to stay contained by resistance, in the 4.2%-4.3% range on the 10yr Yield, but if earnings and economic data come in stronger than expected, that could change quickly and the Fed may be forced to take away the puch bowl from the party. We think that is the biggest known risk to the equity bull trend at present.
Data sourced from FactSet Research Systems Inc.
