US Large Cap. Still in the Driver’s Seat
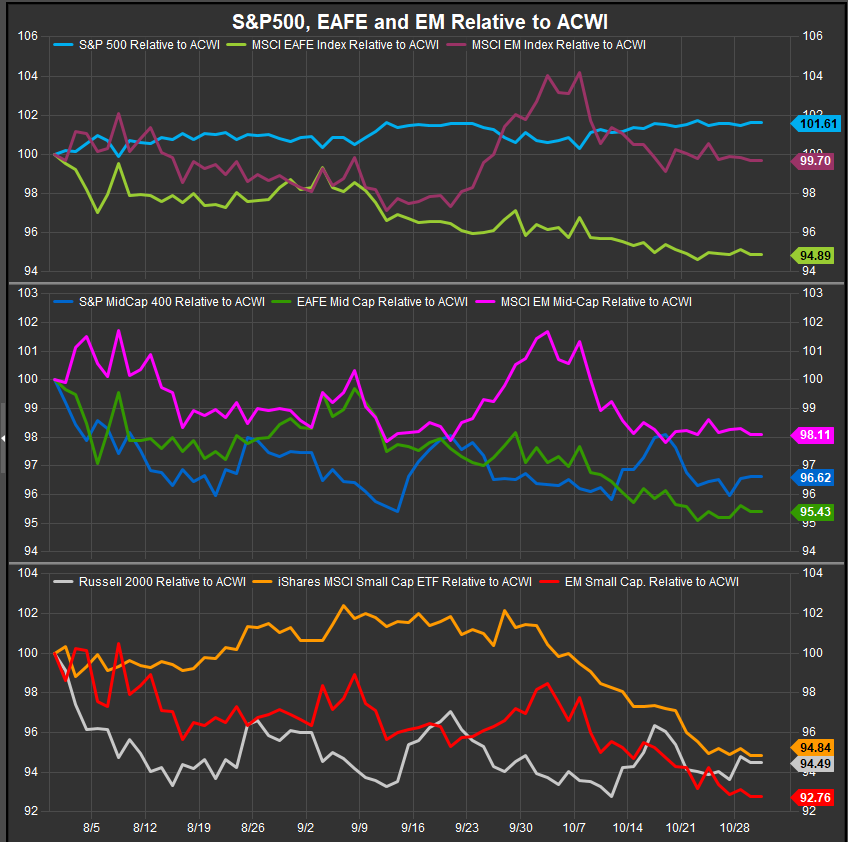
When we last ran this column in the middle of October, EM shares were pulling back from a China-led surge higher. Near-term extreme overbought conditions in a stock or index that has been a long-term laggard can be signs of bullish longer-term trend change, and we have followed the progress of the potential bullish reversal in Chinese equities with interest. However, the long-term track record of Chinese equities has always been somewhat underwhelming. We continue to think domestic US investors should be allocating primarily to US equities at this time. The S&P 500 has re-established its outperformance trend over the past month while ex-US as well as Small and MidCap stocks continue to lag as seen in the chart below.
EM consolidating, still in a potential bullish reversal pattern
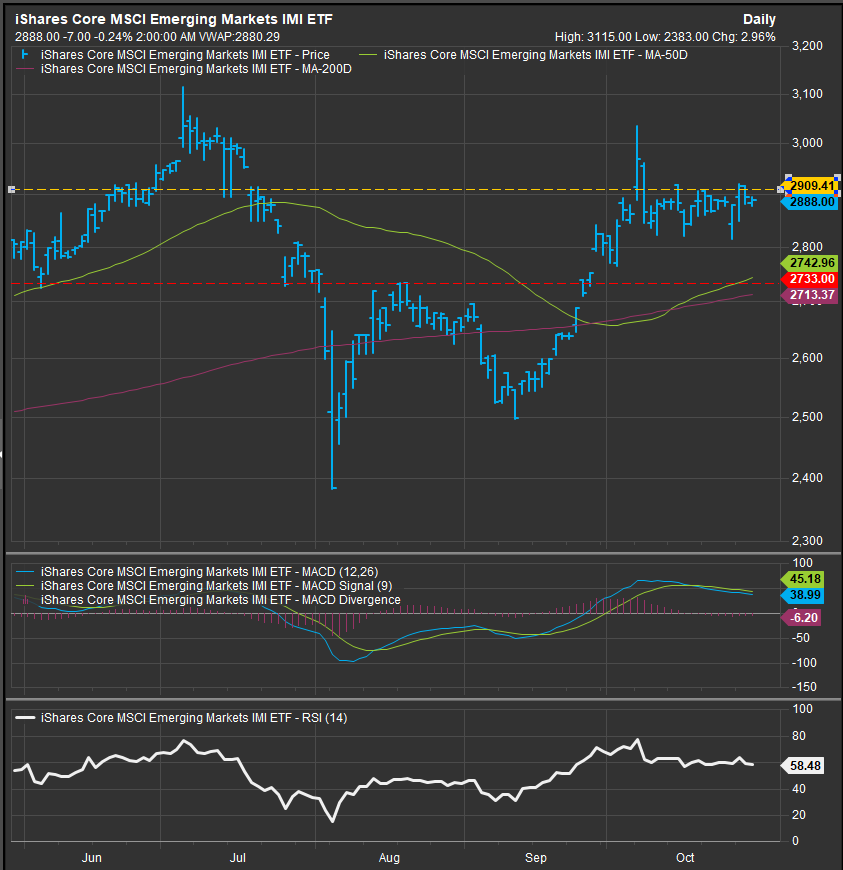
After charging into October leading Global Equities higher, EM and Chinese shares have pulled back. We’ve ID’d the key levels to deciphering the price action below. A bullish reversal pattern remains intact above the 2733 level on the chart, while price above 2909 confirms and has us looking for a move to all-time highs above the 3115 level. We’ve adjusted our upside break-out threshold slightly higher in response to the near-term consolidation that has established 2909 as resistance. A break-out would imply a further 20% upside over the next 3-6 months based on the technical pattern objective. The takeaway is that there remains potential upside in this move over the intermediate term. One circumstance to keep in mind is that while this is a bullish setup for EM, US equities have a bullish setup of their own, and with a weaker JOLTS report yesterday, the risk from higher rates may move onto the back burner.
EM Country Performance
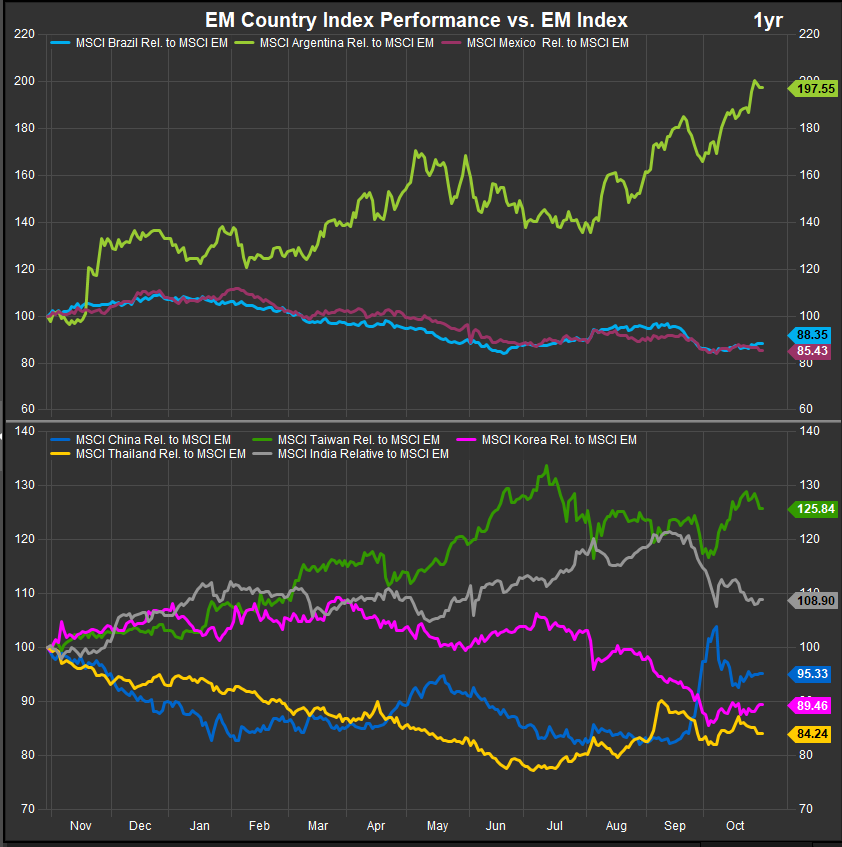
As investors have taken near term profits from the run-up in Chinese shares, we have a potential reset in leadership. Taiwanese and Argentine shares continue to be the top performers in the near-term and over the past 12 months (chart below), but there is also some near-term basing in Indian, Korean and Brazilian shares. Our main takeaway is that price and performance profiles are getting more bullish for EM as risk appetite globally seems to be improving.
Chinese Shares Showing Potential for Additional 20-25% upside.
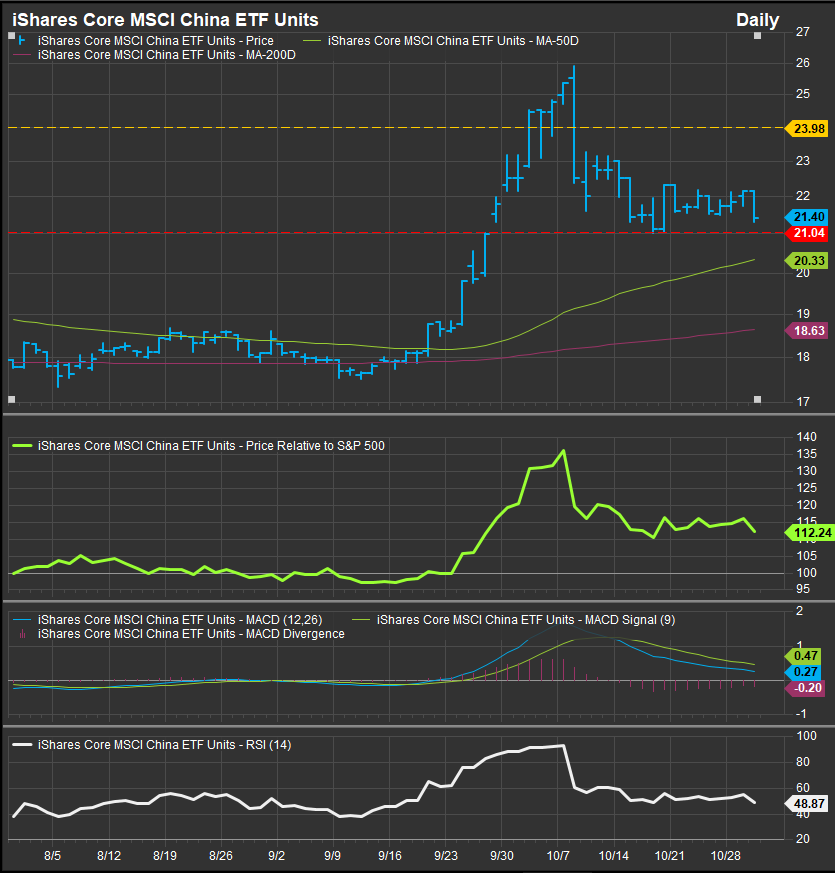
From a technical perspective the rally in Chinese shares has met the threshold for bullish reversal setting up a potential accumulation opportunity for the FOMO crowd. We ID’d $24 as a key level to watch at the beginning of the month for Chinese shares. The rally took out $25 on a weekly RSI reading well above the overbought 70 level. This is a “good” overbought condition as it signals potential for long-term trend change. Some enthusiasm has to be tempered here as Chinese equities do not have a track record of long-term outperformance like US equities do, but we are definitely paying attention as there is potential for a retest up to the $34-35 level on the chart.
As seen on the 3-month price chart below, near-term price action has established the $21 level as support for the bullish reversal pattern. Below that level, bullish prospects diminish.
DM Equities Still Can’t Make any Headway
While there are at least some bullish developments in EM, the same cannot be said for DM markets. As seen in the performance chart at the top of the column, DM Large, Mid and Small-cap. stocks have all lagged the ACWI bench mark by 5% or more.
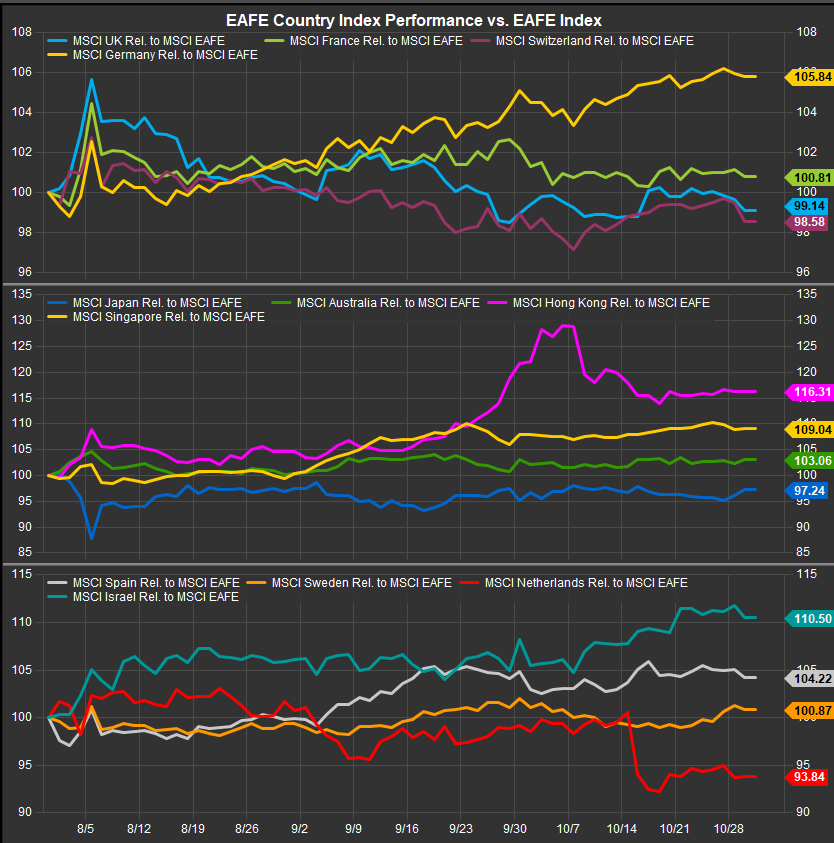
At the country level the best performers over the past 3-months (chart below) are Hong Kong, Singapore, Israel and Germany. These numbers look better than they are however, as we are measuring these country indices against the EAFE benchmark which has been a serial laggard vs. ACWI. Still, except for Germany, these countries are typically on the “risk-on”, higher-beta end of the spectrum within DM, so we interpret this as part of a developing bullish message from equities.
Data sourced from FactSet Data Systems

