
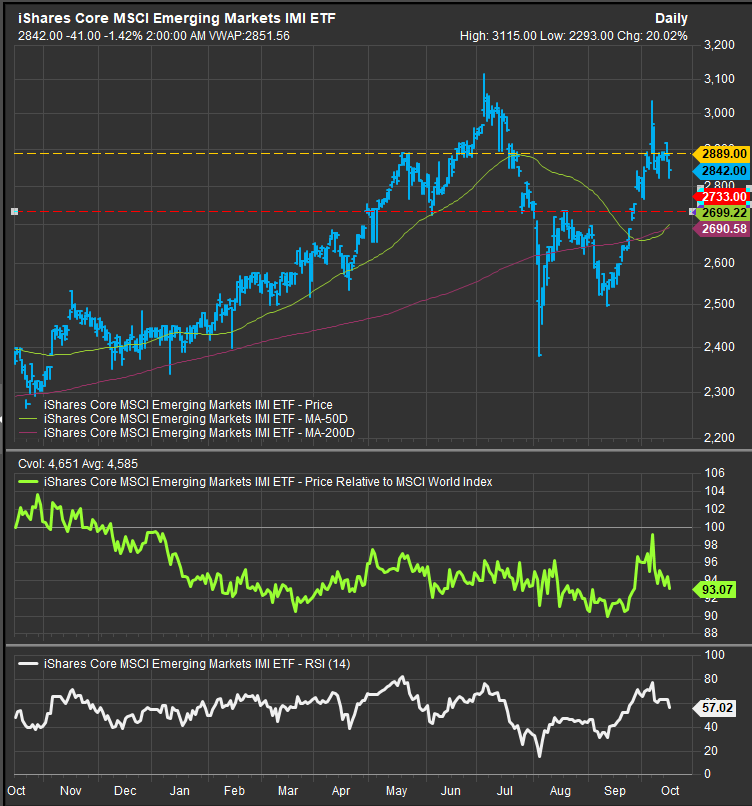
China/EM pulling back, still in a potential bullish reversal pattern
After charginng into October leading Global Equities higher, EM and Chinese shares have pulled back. We’ve ID’d the key levels to deciphering the price action below. A bullish reversal pattern remains intact above the 2733 level on the chart, while price above 2889 confirms and has us looking for a move to all-time highs above the 3115 level. A break-out would imply a further 20% upside over the next 3-6 months based on the technical pattern objective. The takeaway is that there remains potential upside in this move over the intermediate term.
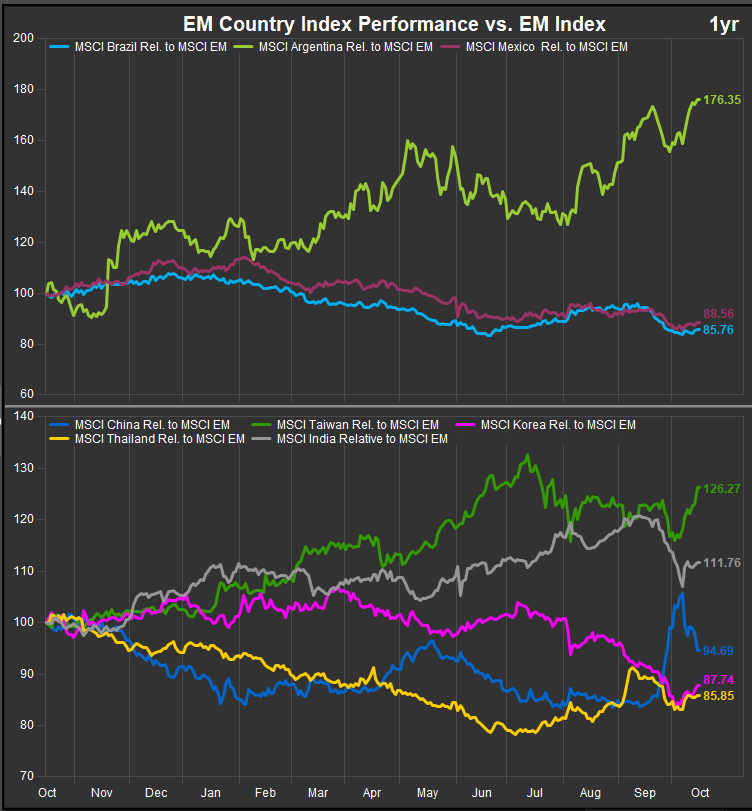
EM Country Performance
As investors have taken near term profits from the run-up in Chinese shares, we have seen previous country leadership reassert itself. The chart below shows EM Index country constituent performance vs. the benchmark. Argentine and Taiwanese shares have moved to new multi-month relative highs.
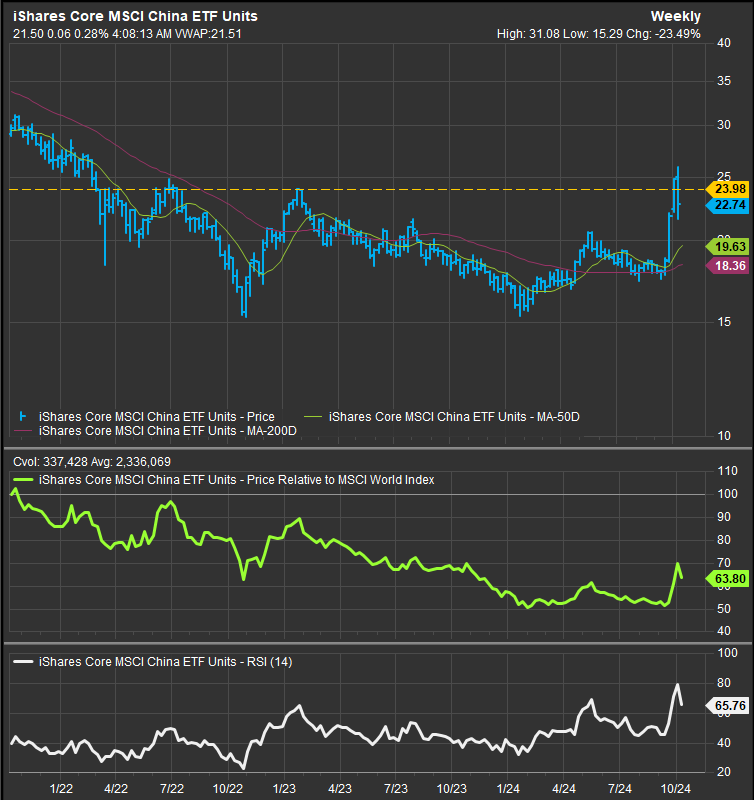
Chinese Shares Showing Potential for Additional 20-25% upside.
From a technical perspective the rally in Chinese shares has met the threshold for bullish reversal setting up a potential accumulation opportunity for the FOMO crowd. We ID’d $24 as a key level to watch at the beginning of the month for Chinese shares. The rally took out $25 on a weekly RSI reading well above the overbought 70 level. This is a “good” overbought condition as it signals potential for long-term trend change. Some enthusiasm has to be tempered here as Chinese equities do not have a track record of long-term outperformance like US equities do, but we are definitely paying attention as there is potential for a retest up to the $34-35 level on the chart.
Data sourced from FactSet Data Systems
