XLB Materials SPDR September Outlook—XLB continues to lag, and while it looks somewhat stronger than XLE it hasn’t been able to break-out of its longer-term underperformance trend. We are seeing some positive signs from a technical perspective, but given we are in a bull market, the sector is not keeping pace.
Price Action & Performance
XLB finished August on a positive note with price registering a marginal new 52-week high at $94.28. That took out the previous April high of $93.72. However, the relative performance of the sector has continued to trend lower throughout 2024 and the oscillator work is getting overbought in the near-term without showing material improvement in performance. This keeps the XLB among our negative outlook sectors despite it showing more positive attributes than XLE.
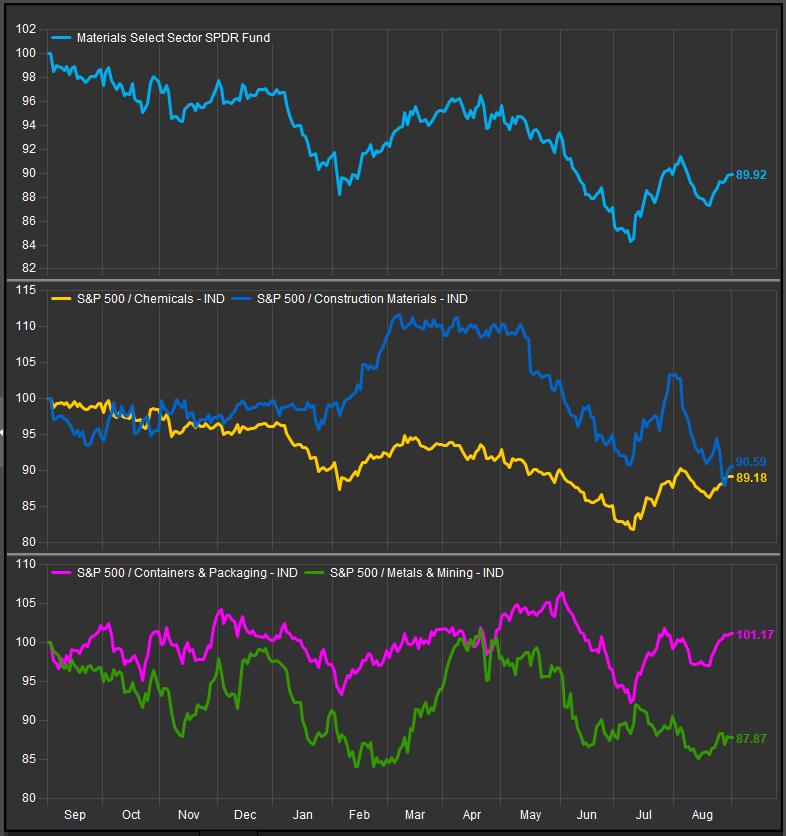
At the Industry level, the Construction Materials Industry has continued its correction from a relative peak in May. The Chemicals Industry has improved since bottoming in early July, but still persists in a longer-term underperformance trend. Containers and Packaging has been the lone industry outperformer within XLB for 2024, while the Metals and Mining Industry continues to lag after its big run up in 2021-22.
At the stock level we still see more sell-rated charts than buy rated. Our favorite stocks within the sector from a technical perspective are LIN, SHW, ECL and PKG.
Economic and Policy Drivers
The biggest headwind to the XLB is the weakness manifesting in Commodities Prices. The Bloomberg Commodities Index has declined by 10% over the past 12 months while the S&P 500 has gained >25% during the same timeframe. XLB performance is highly correlated to the direction of Commodities prices, and we aren’t seeing any bullish signs for the latter. On-shoring/Re-shoring has been a huge tailwind to construction materials stocks, but performance has been consolidating over the intermediate-term leading us to conclude that the bullish re-rating in those stocks has likely been priced in. The outcome of the US election would likely have some impact on the Materials Sector’s prospects as Former President Trump’s import tariffs in 2017 benefitted US producers but raised costs for consumers. Candidate Trump’s also enacted the Tax Cuts and Jobs Act of 2017 which allowed businesses to immediately expense 100% of the cost of eligible properties, which is a potential boon for capital intensive industries within the sector. Trade agreements like the tri-lateral USMCA will be worth watching as well.
The Federal Reserve’s interest rate policy could also lead to positive outcomes for the XLB as its performance has improved slightly since policy expectations have switched from hawkish to dovish over the summer. So far, the XLB hasn’t been a particular standout, but it has shown some modest improvement.
In Conclusion
While we prefer XLB to XLE, both sectors haven’t done enough to trigger a positive allocation in our model. Our new Elev8 sector selection process starts September with a Zero-weight allocation to the XLB of -2.25% vs. the S&P 500 Index.
Chart | XLB Technicals
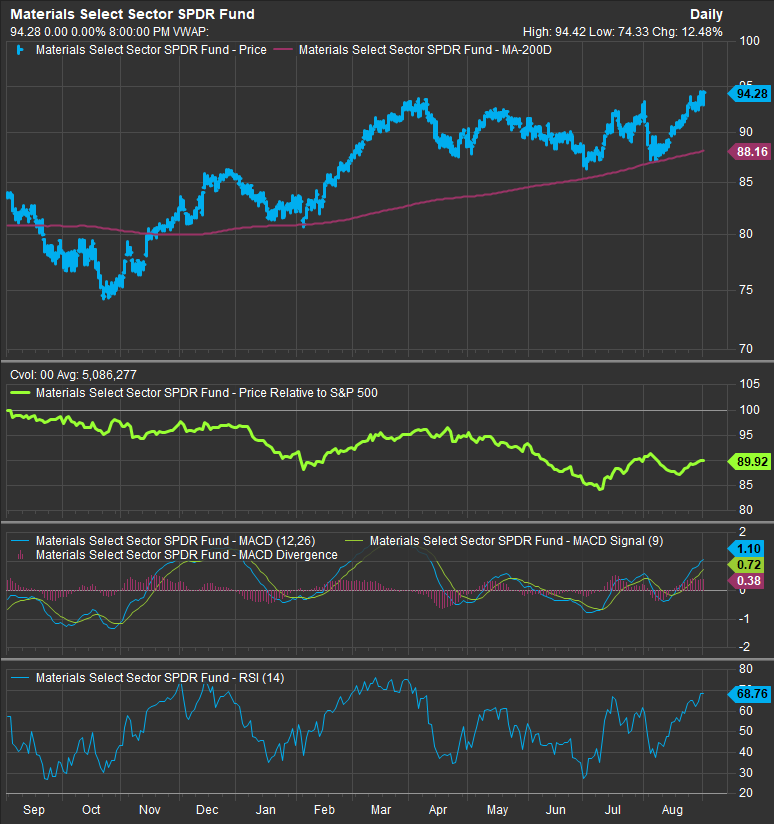
- XLB 12-month, daily (200-day moving average | XLB Relative to SPX |14-day RSI | 12, 26, 9 MACD)
- XLB has shown signs of bullish reversal on price, but still lags the benchmark over the intermediate and longer-term timeframes.
- Overbought oscillators in a weak trend set the stage for near-term correction
XLB Relative Strength vs. S&P 500: Sector and Industry Level
Data sourced from FactSet
