
You wouldn’t know the Fed came out with a dovish policy prescription by looking at the price action in XLE.
Price Action & Performance
September saw XLE trade to a new multi-month low on price and continue its performance downtrend relative to the S&P 500 Index. Oscillator work at the sector level has not shown any positive 2nd derivative characteristics as downside momentum persists. There are no obvious signs of a turnaround at present from a technical analysis perspective.
XLE price is coming into a support zone between $80 and $85 on the chart. The WTI Crude chart is also at long-term support near the $68 level. This is the one characteristic that argues for potential opportunity as the best thing that can be said about the Energy sector is that it is oversold and unloved. We are seeing some signs of life from the Bloomberg Commodities index, but so far that price action has been motivated by inputs other than Crude, so we don’t have a reason to get more constructive on the space.
At the stock level, the best charts from our view continue to be income generating areas of the sector. Oil Storage and Transport Co.’s and MLP’s are where the strongest performance in the sector is. TRGP, OKE, WMB and KMI are among the best performing Energy Sector charts and are our highest rated stocks currently.
Economic and Policy Drivers
The Energy Sector price bounced in July on optimism that Donald Trump will regain the presidency. A Republican administration is perceived as bullish for legacy energy producers which comprise the lion’s share of the GICS Energy Sector. Concerns of a global supply glut remain amidst societal trends away from fossil fuels (vehicle electrification, alt. energy infrastructure, ex-US ESG initiatives) and ever more readily available alternative energy streams coming online.
The switch to dovish Fed. policy has potential to rejuvenate the Energy sector as lowering interest rates could potentially spur capital investment. However, given the competitive race for the presidency at this point, it is just as likely that key Biden administration policies like the Inflation Reduction Act of 2022 and the Infrastructure Investment and Jobs Act will continue to be promoted. Those policies attempt to curb methane emissions and to expand infrastructure and tax credits for EV’s which contribute to secular headwinds for the sector.
Continuing fighting in the Middle East has not provided any boon to prices despite 11 months of combat involving many major players in the region.
We do think that if Candidate Trump gains in the polls, the XLE will likely rise as well, but that’s not an outcome we are willing to bet on at the start of the month given the state of our indicators for the Sector.
In Conclusion
Despite some rotation away from Mega Cap. Growth, we haven’t seen any sustained benefits to XLE in the short or intermediate term. Our Elev8 Sector Rotation Model Portfolio starts off October with a zero-weight allocation to XLE leaving us 3.42% BELOW the benchmark S&P 500.
Chart | XLE Technicals
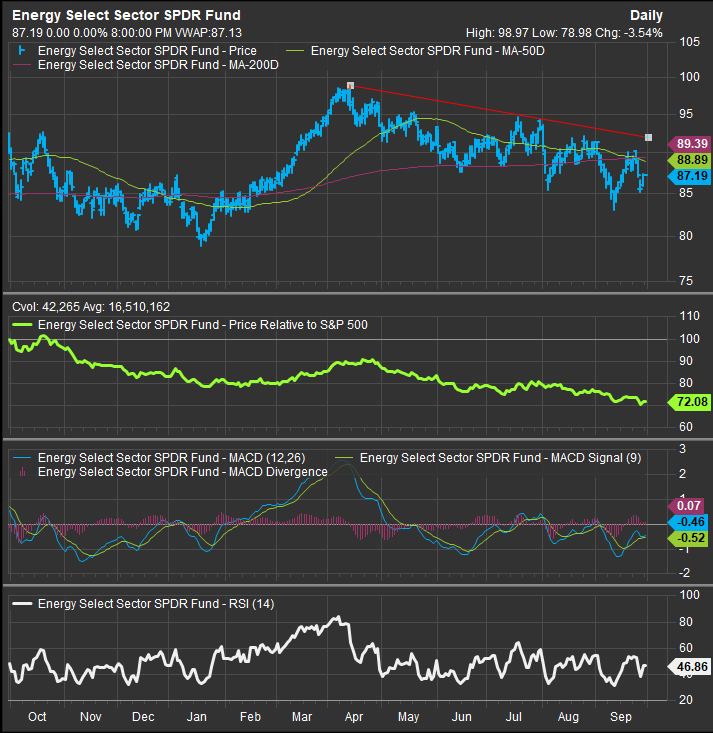
- XLE 12-month, daily price (200-day m.a. | Relative to S&P 500)
- Price continues below downtrend resistance while oscillators like RSI and MACD have failed to show any buying enthusiasm
XLE Relative to S&P 500 with Industry and Sub-Industry Relative Strength, T3M

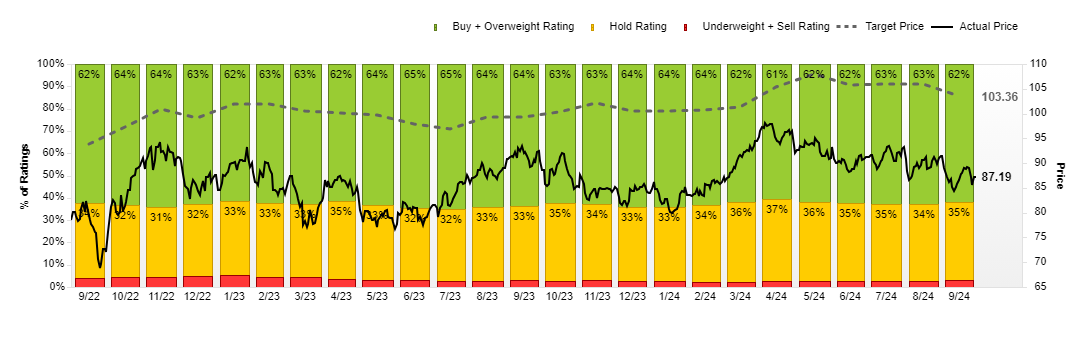
XLE Street Analyst Ratings and Price Targets:
Data sourced from FactSet Data Systems
