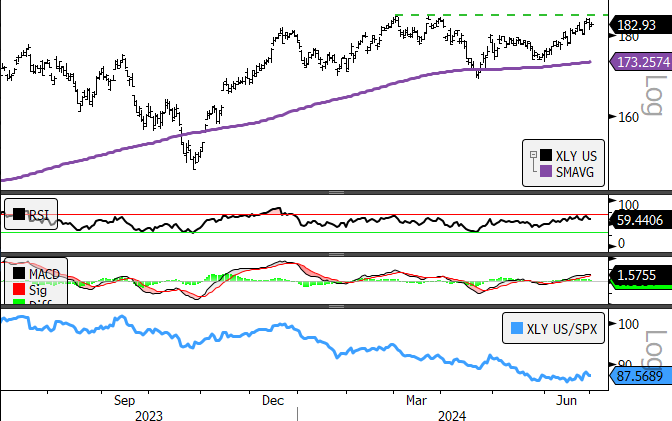
XLY has gone from negative to positive during June in our Elev8 Sector Rotation Model. Keeping in mind that the S&P 500 remains in a long-term bull market trend, we are taking the near-term improvement as an opportunity to go long the Sector which is historically among the best bull market performers relative to the benchmark.
Price Action & Performance
XLY outperformed on a monthly basis in June for the first time since February. Price is now challenging intermediate-term resistance at $185 on the XLY chart. A break-out would project a retest of early 2022’s all-time highs for the sector over the intermediate to long term which would represent about 15% upside from today. The dislocation between the bull market trend manifesting the S&P 500 index and the now multi-year underperformance of the XLY has us betting on mean-reversion now that we’ve seen near-term signs of buyer interest in the sector. A break-out above the $185 level would be a bullish “tell” in the near-term for the ETF.
At the industry level, near-term strength in AMZN and TSLA are improving Multi-Retail and Autos. The Specialty Retail Industry is also attempting to stabilize while Auto Components, Textiles & Apparel, Distributors and Hotel & Restaurant industries continue to show weakness. A key group will be Homebuilders which are near-term oversold after being one of the few ex-Mag7 leadership cohorts in the longer-term bull market advance.
Economic and Policy Drivers
The pivot for XLY is likely to come from changing perceptions of the Fed.’s interest rate policy outlook. Higher rates have put the brakes on Homebuilders and home improvement retail as well as discretionary spending in general. Higher labor costs are contributing to a raft of higher prices across consumer facing industries and higher financing costs are destroying home affordability by making building costs more expensive and mortgage costs prohibitive. A Fed. policy reversal would have potential to change those trends and would likely help loosen lending standards incrementally moving forward which would spur many areas within the Discretionary Sector which have been deeply discounted in the interim.
How Can XLY Help?
XLY offers the broad exposure needed to shift allocation at a low cost when prospects for the Sector are uncertain. With 52 stocks across 9 industries, XLY shares offer diversification at an affordable price. If sticky inflation turns out to be less sticky when July’s CPI hits, adding to an XLY position would be a cost-effective way of covering shorts in some of the most washed-out stocks that would be likely beneficiaries of lower rate dynamics and lower inflation.
In Conclusion
XLY has shown signs of bottoming as inflation has continued to dissipate. Investors are starting to gain conviction that the Fed. will be more accommodative to equities in its forward interest rate policy prescriptions as a flagging consumer and slowing industrial production have the potential to supplant inflation as a primary concern. With the backdrop of an 18-month bull trend in the S&P 500 and the XLY’s historically positive correlation to the index, we have initiated a long position in the sector for July. The XLY is an OVERWEIGHT position for July in the Elev8 Model Portfolio with a +2.55% allocation vs. the S&P 500 weight.
Chart | XLY Technicals

- XLY 12-month, daily price (200-day m.a. | Relative to S&P 500)
- The rally in June has been impressive enough to trigger a clear MACD buy signal
- A move above $185 would complete an intermediate-term base break-out that projects a retest of the early 2022 highs +15% above today’s price
Data sourced from Bloomberg
