ETF Insights| October 1, 2024
XLY performance broke out decisively to the upside in September forcing us to close our short in the sector and go long on September 19th. We start October with a positive outlook on the Discretionary Sector with a long position in our Elev8 Sector Rotation Portfolio.
Price Action & Performance
Price broke out to new all-time highs for XLY on September 18 forcing us to close our tactical short on the sector and move to an overweight position. Relative performance at the sector level broke a 12-month downtrend channel and sets the stage for potential reflation. The XLY is now just 5% below all-time price highs made in Q4 of 2021. The technical set-up is a multi-year base that would project roughly 42% technical upside on a break-out above the $210 level. We would ascribe a long-term price target of $300 for XLY if that move were to develop. The setup is starting to resemble what most investors would expect out of a bull market.
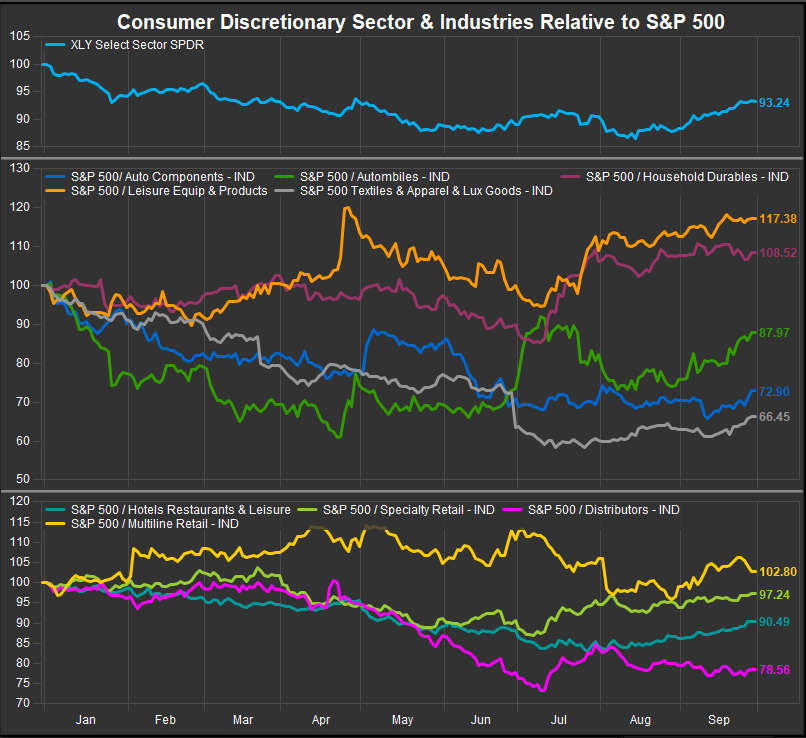
At the Industry level, only 3 of 9 industries within the sector are outperforming YTD. The clear leadership resides with Homebuilders and the Household Durables Industry. However, in the past 3-months 8 out of 9 large cap. Discretionary industries have outperformed with Leisure Equipment and Products leading. This is a clear projection of a bullish policy outcome as the consumer balance sheet has been constrained by high cost for most of this equity bull cycle and the sector, consequently, has lagged.
At the stock level we still find breadth is poor and the average stock is somewhat uninspiring over longer-term timeframes. However, the response to interest rate cuts has been broad and enthusiastic. As a result, we are betting on continued reflation as this is one of the sectors, along with Materials, that is starting to rerate positively in the wake of rates moving lower. Our favorite stocks within XLY are DHI, LEN, NVR, PHM, BKNG, CMG. We are constructive on AMZN and have moved back to a positive view on TSLA. We have an unfavorable view on TSLA which is at a very interesting point on its stock chart.
Economic and Policy Drivers
The Discretionary sector has been in an underperformance trend vs. the S&P 500 since late 2021 due to the Fed’s policy errors which led to rapidly increasing housing and labor costs, both headwinds for the consumer. We are finally seeing some bullish signs of life as dovish policy easing becomes the consensus forward expectation.
Yields have re-rated lower on dovish expectations for the remainder of 2024. The Fed spiked the punch bowl with an initial 50-bp cut and a promise of 50bps more of cuts into year-end. Yields on the 2yr and 10yr now sit below 4% and are down roughly 100 bps since making highs for the year in April.
We are entering peak election season with our two candidates staking out vague, but different ideas for the coming administration. It’s important to note that despite the rhetoric, Former President Trump’s policies led to some inflationary outcomes though they clearly benefitted commodity’s adjacent sectors. On the other hand, Vice President Harris has discussed affordability which hints at potential changes in regulation and oversight. So far, she has outlined expanding the Child tax credit as a policy tentpole.
At present, tax credits for EV’s and energy efficient home improvements remain in place which offer the potential to lower energy costs over the longer term. A big key for XLY going forward will be the direction of rates. The Fed has been able to control the narrative in favor of lower rates ahead of its September policy move, but bullish expectations may cloud the outlook as Commodities prices have started to rise already. If rates follow suit on bullish expectations, the Fed may have a harder job controlling yields which could complicate policy outcomes.
In Conclusion
XLY has started to benefit from the change in Fed policy and outlook. It has shown some technical improvement over the previous 3-months, and we have seen our buy signals triggered. We start October with an OVERWEIGHT position of +3.79% in XLY vs. the S&P 500 weight in our Elev8 Sector Rotation Model Portfolio.
Chart | XLY Technicals
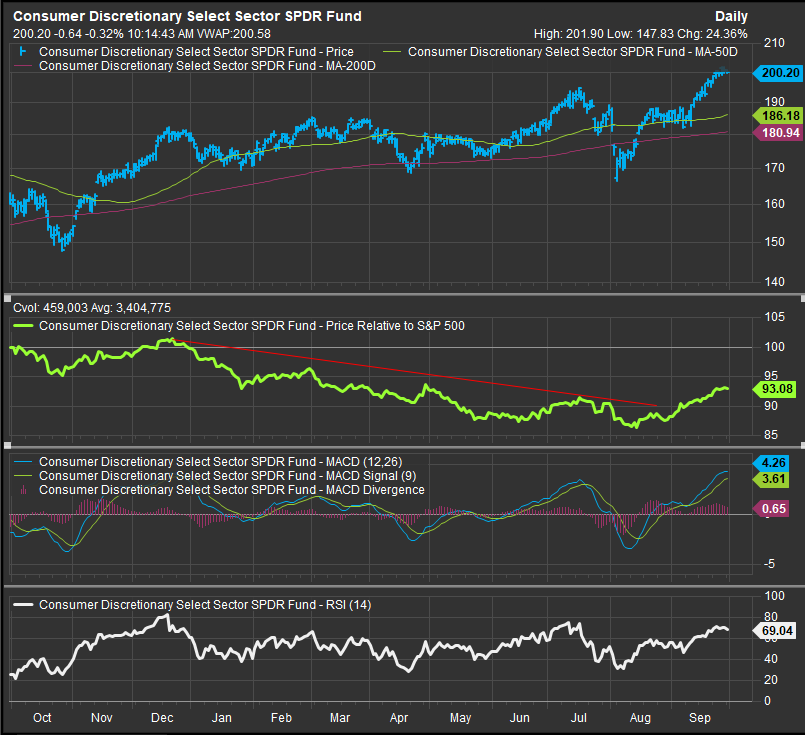
- XLY 12-month, daily price (200-day m.a. | Relative to S&P 500 |MACD|RSI)
- Clear bullish reversal pattern, though some near-term risks from overbought conditions
XLY Relative Performance | Industry Level Relative Performance | 3m
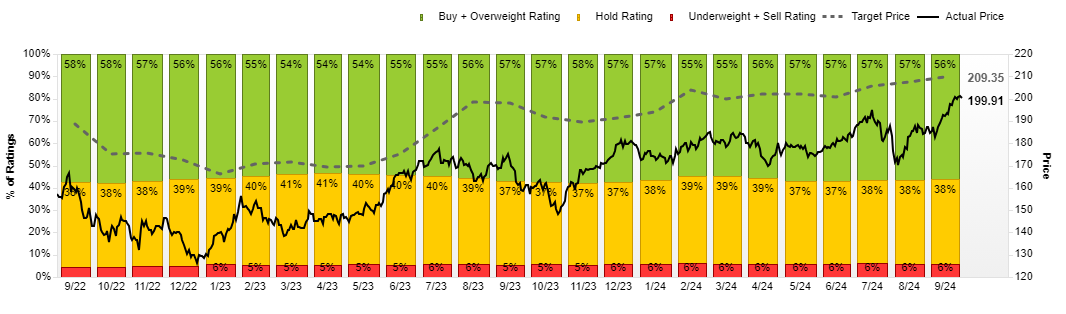
XLY Street Analyst Ratings and Price Targets:
Data sourced from FactSet
