At ETFsector.com we provide tools and insights to help our community appreciate and understand the benefits of sector investing. We are pleased to offer the fourth installment of our deep history Sector Trend Studies to provide you with a deeper understanding of the historical behavior of these groups of businesses in relation to broad market and macro trends.
This article delves into historical sector returns during intermediate-term (and longer) periods of time when USD price, proxied by the DXY Index, is in an uptrend pattern and generally falling over a sustained period.
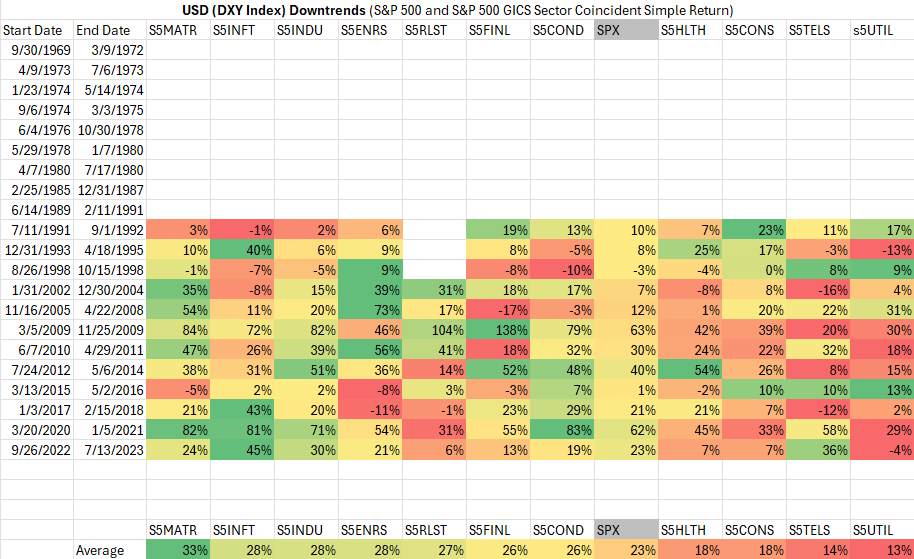
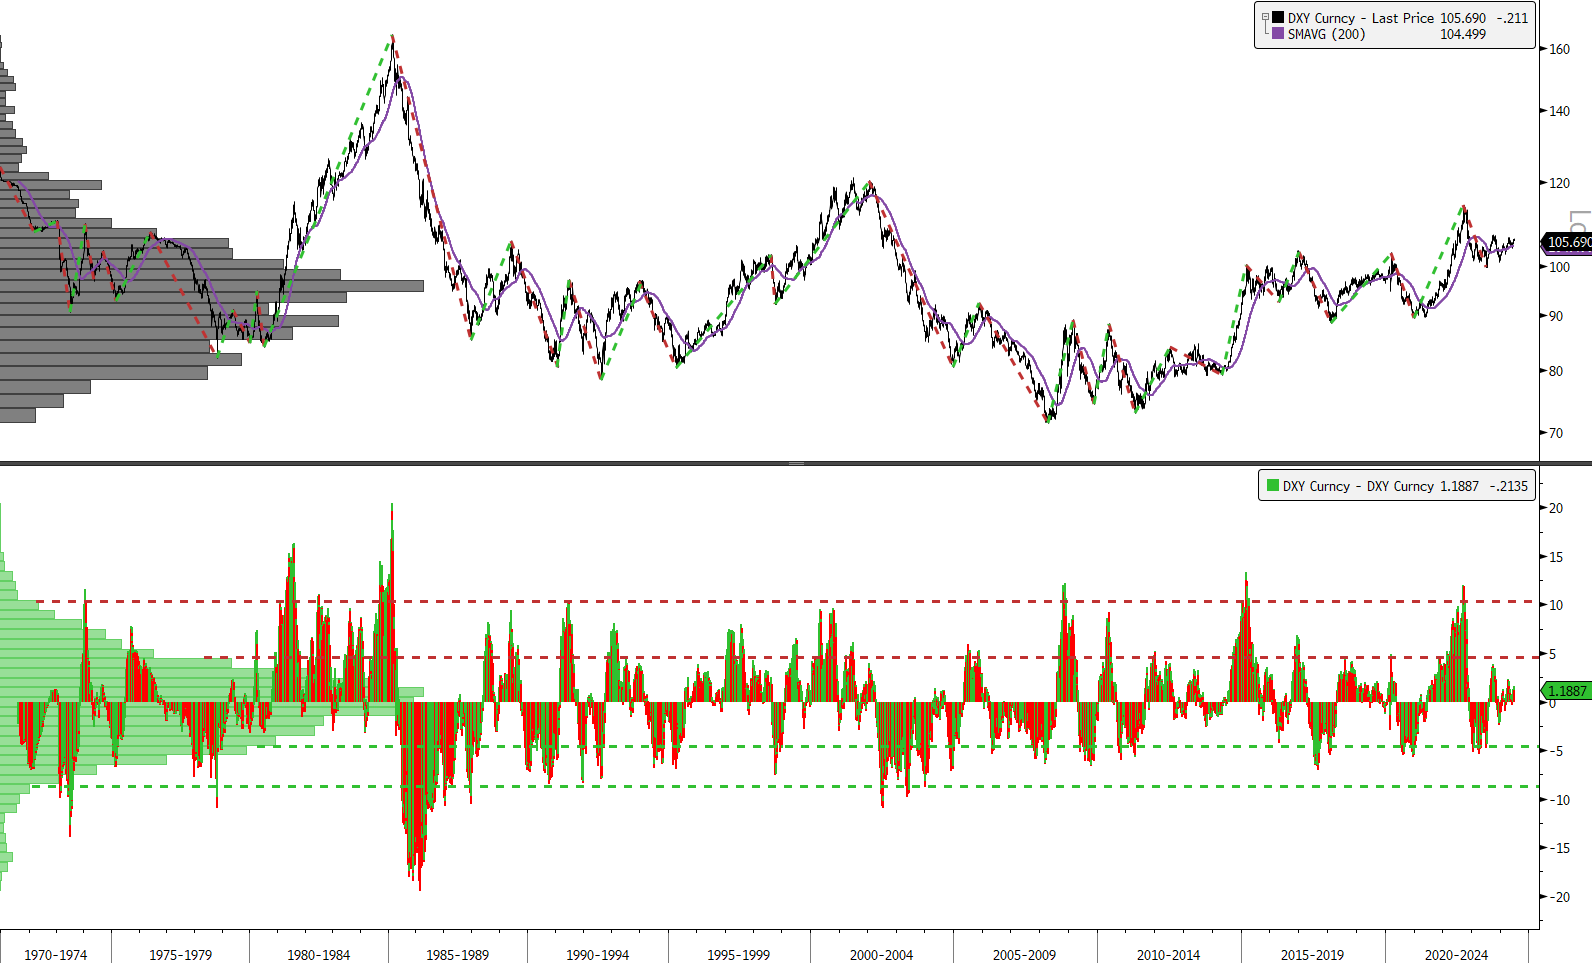
Sector Trend Studies measure the coincident returns of the 11 GICS sectors during longer-term USD Downtrends vs. a basket of Developed Market currencies using the DXY Index as a proxy. The historical trends are shown below. They are backwards looking, selected by a smoothing process that ID’s inflection points in trend relative to price dislocation from the historical 200-day moving average. These studies are presented in color coded tables that look like traditional heatmaps. However, they are color-coded horizontally by row which highlights the leading (Green) and lagging (Red) areas of the market during each identified uptrend for the DXY Index going back to 1989.
While we all can likely recite the warning, “past performance is not indicative of future returns,” knowing the profiles of sector returns from history, how they’ve changed and how they have related to the manifestation of business cycles and other macro level trends in the past, helps us formulate strategies in the present. These historical returns offer what we like to call “Reality’s Playbook.” We can start with these historical return profiles as our reference scenario for expected sector returns given the prevailing macro environment. We can then use macro, fundamental and technical research to get views on the current prevailing trends in each sector as well as the current coincident stock performance and easily ascertain “what’s different this time!” This approach allows us to leverage the current performance of assets as an indicator of potential long-term trend change for a Sector or Industry or as a shorter-term indication of dislocation and allows us to focus our research assets on areas of the market that currently suit our needs or that might offer opportunities from dynamic change.
It is our hope that this information and perspective will be additive to existing investment processes rather than a challenge to them. We think its greatest utility is helping investors keep the behavioral dynamics of the market involved in their research process, helping avoid unintended risks from over-reliance on theoretical models. We use these tables as a component of our own research to align with the dominant macro trends affecting markets and to see which sectors are behaving contrary to expectations.
| USD Index Downtrends (S&P 500 and S&P 500 GICS Sector Coincident Simple Return) |

DXY Index with Historical Intermediate and Long-term Trends

Sources: Bloomberg
