At ETFsector.com we provide tools and insights to help our community appreciate and understand the benefits of sector investing. This leverages a similar methodology to our sector trend studies series to look intra-sector to help investors understand both positive and negative historical contributions to return and the GICS Industry and Sub-Industry level. We believe that by understanding historical relationships between price returns and macro trends we can gain an edge in deciphering the dynamics of the present.
Sector Trend Studies measure the coincident returns of the 11 GICS sectors during longer-term USD Downtrends vs. a basket of Developed Market currencies using the DXY Index as a proxy. The historical trends are shown below. They are backwards looking, selected by a smoothing process that ID’s inflection points in trend relative to price dislocation from the historical 200-day moving average. These studies are presented in color coded tables that look like traditional heatmaps. However, they are color-coded horizontally by row which highlights the leading (Green) and lagging (Red) areas of the market during each identified uptrend and downtrend going back in history to 1989.
Sector: Financials
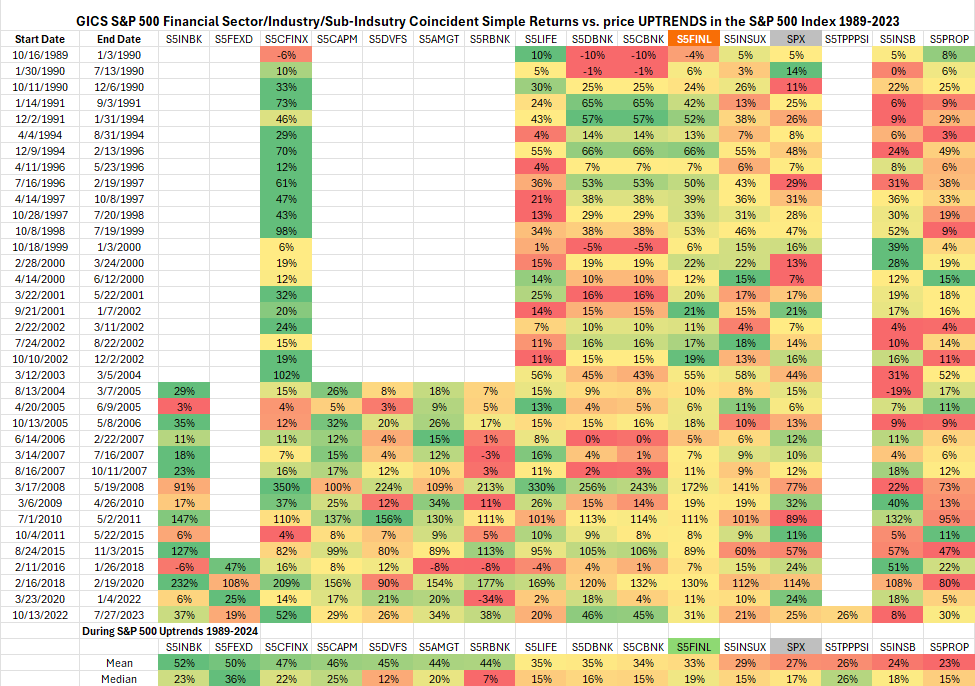
Sector/Industry/Sub-Industry Coincident Returns in Equity (S&P 500) Uptrends 1989-present

Sector/Industry/Sub-Industry Coincident Returns in Equity (S&P 500) Downtrends 1989-present

Sector/Industry/Sub-Industry Coincident Returns in Interest Rate (US Generic 10yr Yield) Uptrends 1989-present

Sector/Industry/Sub-Industry Coincident Returns in Interest Rate (US Generic 10yr Yield) Downtrends 1989-present

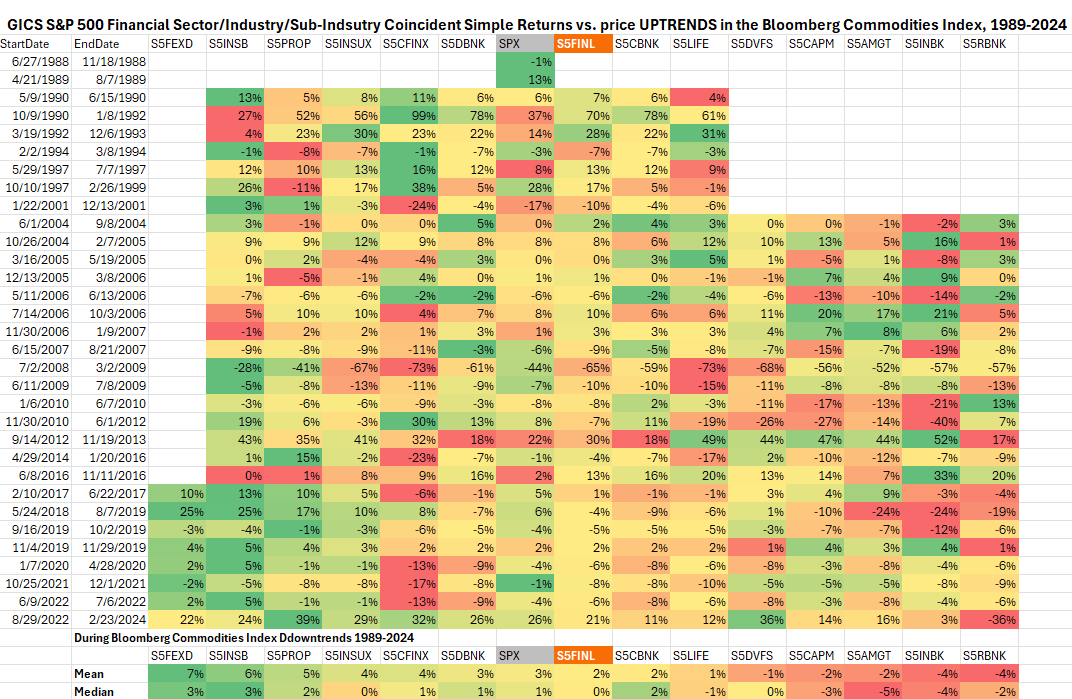
Sector/Industry/Sub-Industry Coincident Returns in Commodities Price (Bloomberg Commodities Index) Uptrends 1989-present

Sector/Industry/Sub-Industry Coincident Returns in Commodities Price (Bloomberg Commodities Index) Downtrends 1989-present

Sources: Bloomberg
