June 8, 2025
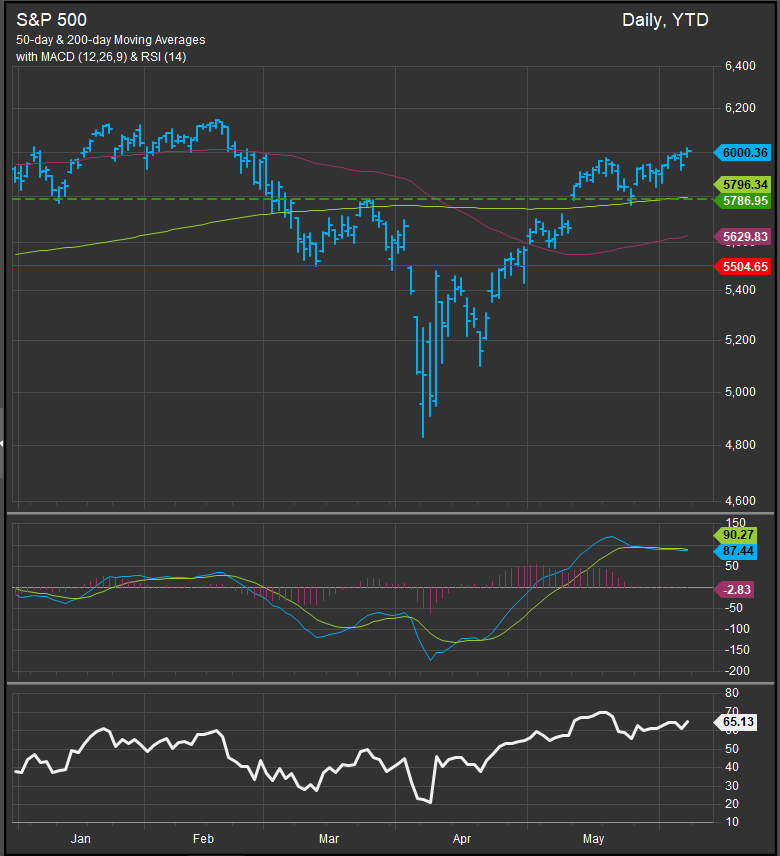
The Bull must be feeling pretty confident with the S&P 500 closing last week above the 6000 level (chart below). The buyer has kept its foot on the gas despite the index reaching overbought conditions in mid-May and the current price is <3% below the all-time high. The usual gripes can still be counted on. Small and mid-cap. stocks continue to underperform. Mega-cap. growth accounts for most of the gains, but we’re not here for whining. We want to invest in the prevailing trend as long as it checks our boxes for health. So let’s take a look.
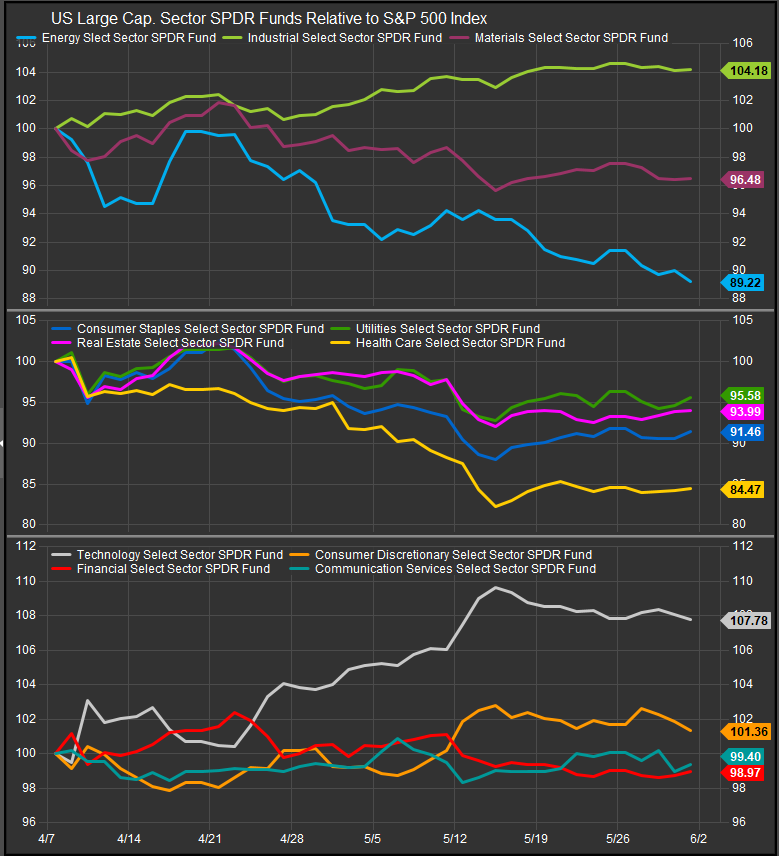
Cyclical Sectors Outperforming
Our sector performance chart shows Industrials, Technology and Discretionary stocks outperforming from the April 7th low for equities. Lower vol. sectors have been redeemed, while Energy and Materials stocks have begun to firm. Financials and Comm. Services stocks are the pivot at this point. They’ve given up a small amount of ground in May and their performance is something to watch in June for the health of the bull trend.
Semiconductors and Mag7 Improving
The Philadelphia Semiconductors (SOX) Index has outperformed the S&P 500 since the low (chart below, panel 2). We are looking for price to move above the 5455 level to confirm the bullish reversal.
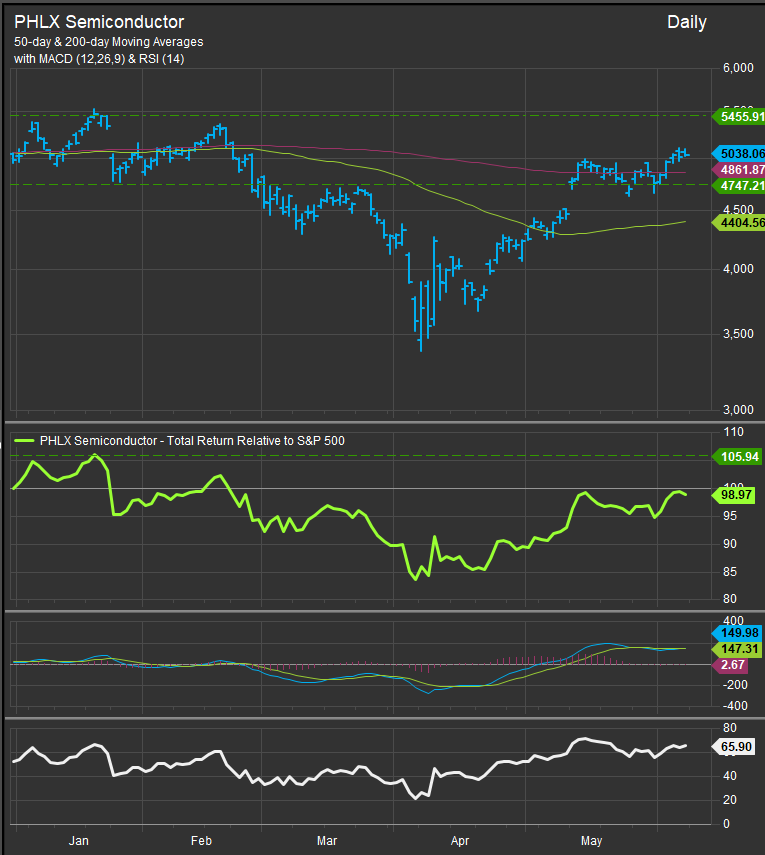
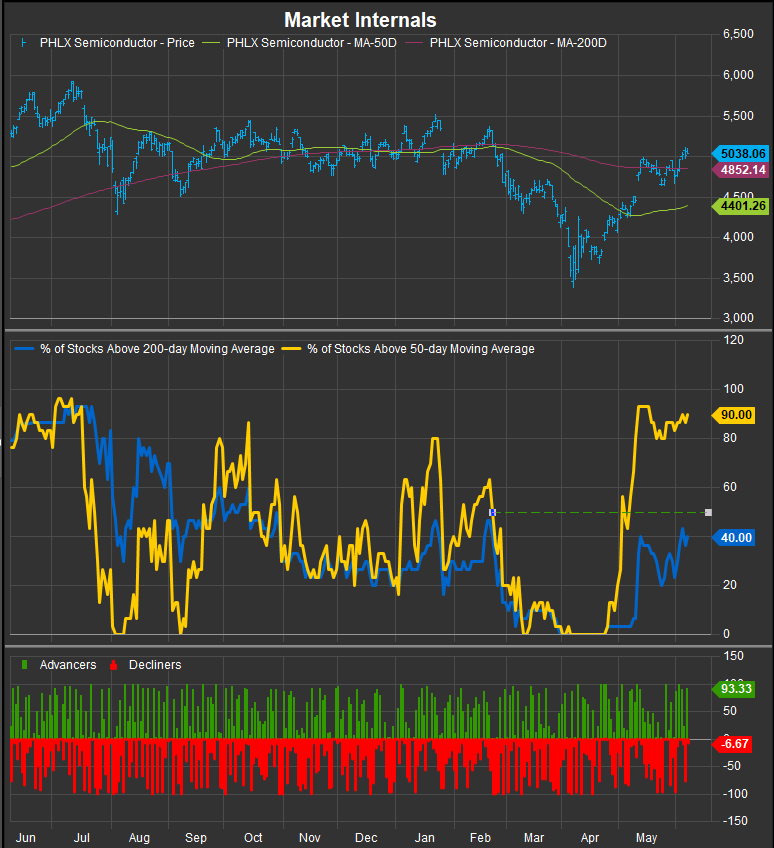
We will concede participation has been an issue for the Semiconductor industry. Through the first half of 2024 a majority of SOX Index constituents were above their 200-day moving average (chart below, panel 2, blue line). We need to see that line move through its February 2025 high at 50 at a minimum to confirm the price action in the index.
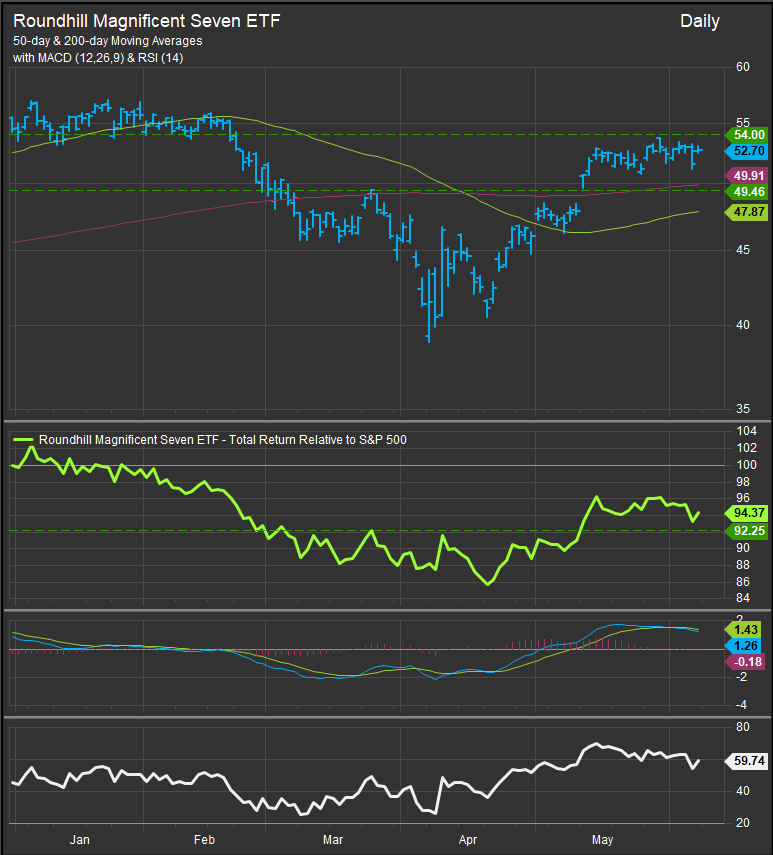
The Roundhill Magnificent 7 ETF (MAGS) has also been outperforming the market since the April 7 lows (chart below). We see the $49-54 level as the pivot on the chart.
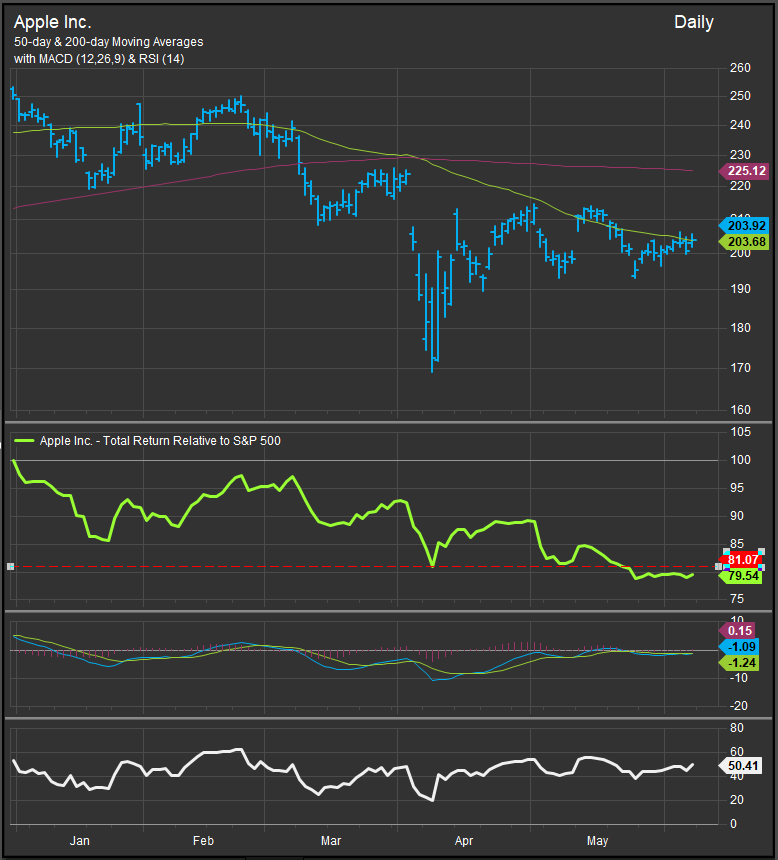
Among Mag7 constituents, AAPL has triggered a sell signal in our work (chart below). The stock has underperformed since the equities put in their low and faces pressure from supply chain tensions between the US and China. We’re not expecting Mag7 to stay as a monolith or Mega Cap. dominance. We do, however, need to see a majority of constituents acting well to support the bull trend and that is in place.
Concerns: The Re-emergence of Inflation
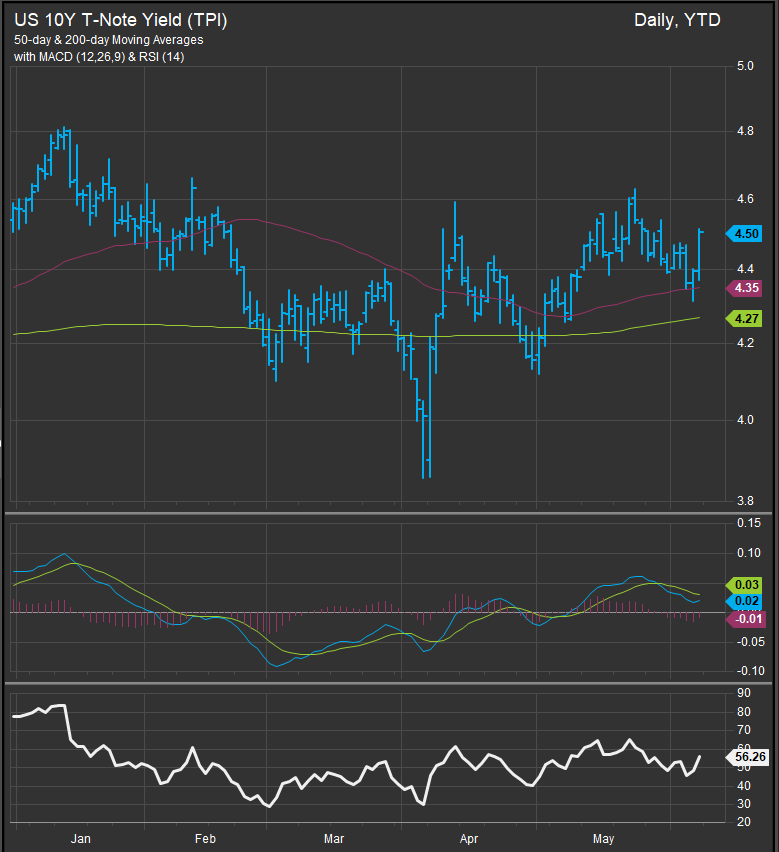
With a number of trade agreements in hand, the Trump Administration has restored the market’s confidence in the overall gameplan. The potential fly in the ointment is that interest rates have begun to rise again. The US 10yr Treasury Yield (chart below), jumped above the 4.5% level to close last week with oscillator studies moving up from a higher low.
Leverage points over base metals and rare earths are a factor behind rising rates. Crude prices are also bouncing from deeply oversold levels (chart below). The WTI contract is at $64.79 on its way up from $58 with $66 key overhead resistance.

Given some discounting of tightening bottlenecks and rising crude prices, the Bloomberg Commodities Index (chart below) has firmed to the 103 level in the near-term.
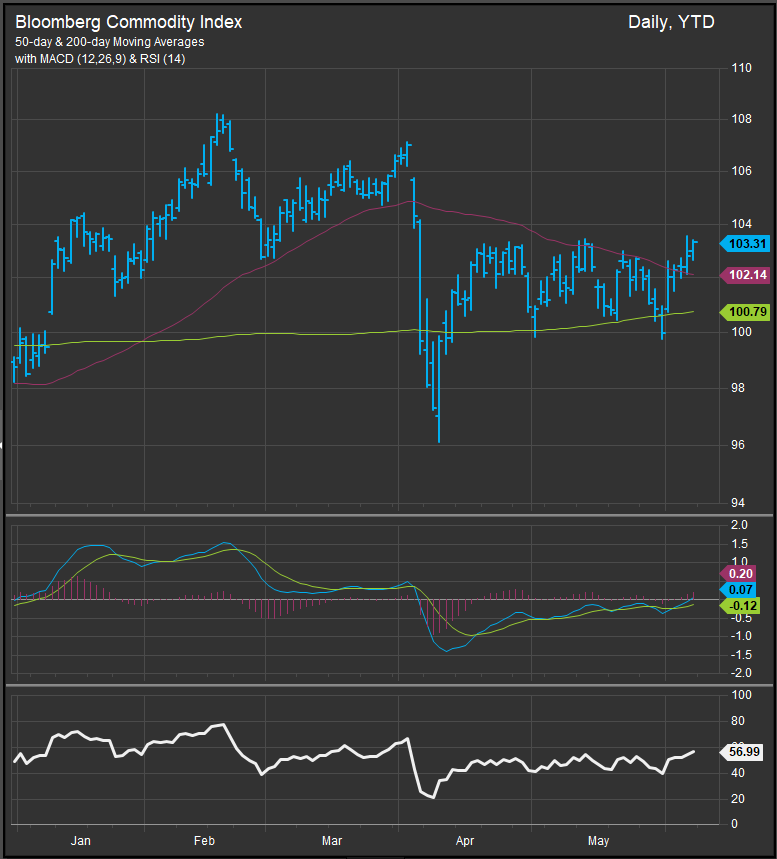
Given rising Crude and Commodities prices more broadly, we’re looking at the 108 level on the Bloomberg Commodities Index and the 4.75% level on the 10yr treasury note as levels where we are likely to see equities come under selling pressure.
Conclusion
The bullish reversal in equities has exhibited improved risk appetite and strong technical behavior. Our primary concern is inflation pressures from a combination of rising input prices and an economy that is still near full employment. In 2024 the data threaded the needle and CPI readings stayed contained. If we start seeing hotter prints this time around, investors may have seen enough. Keep an eye on yields. We don’t think the bull will suffer them going too much higher.
Patrick Torbert, Editor & Chief Strategist, ETFSector.com
Data sourced from FactSet Research Systems Inc.
