

Can the AI trade climb the “Wall of Worry” that is longer-term inflation?
The 10-year Treasury market is pricing a higher real-rate regime built on resilient growth, renewed supply shocks, heavy capital demand and a Fed that still needs more evidence before relaxing its inflation guard.
The latest rate configuration tells the story. The 10-year Treasury yield was 4.71% on July 23, while the 10-year TIPS real yield was 2.43% and the 10-year breakeven inflation rate was 2.28%. In other words, more than half of the nominal 10-year yield is coming from the real-rate component, not from long-term inflation expectations.
That distinction is important. A 4.7% 10-year Treasury yield does not mean the bond market expects 4.7% inflation for the next decade. The breakeven market is closer to the low-2% range. What investors are pricing instead is a higher real return requirement for owning duration in an environment where inflation volatility, Treasury supply, corporate borrowing, AI investment demand and Fed uncertainty remain elevated.
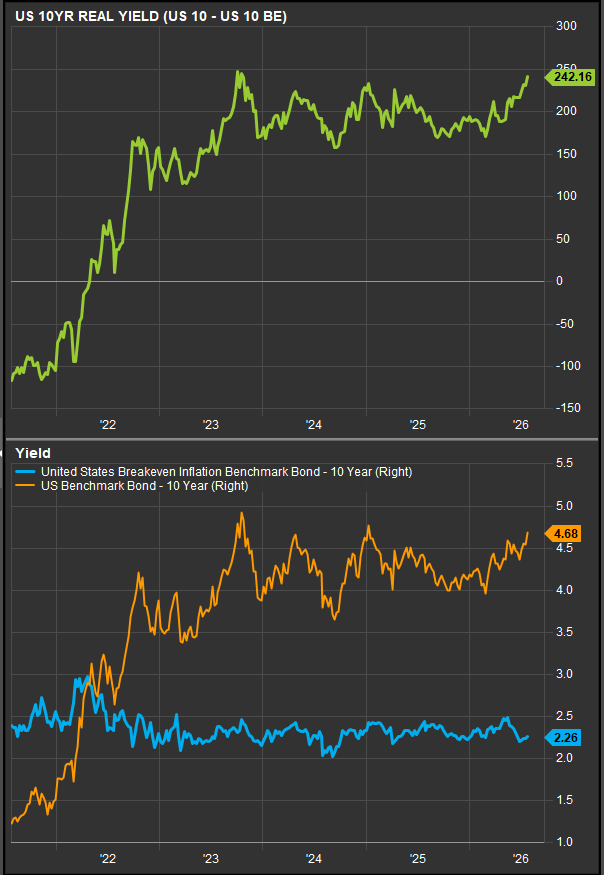
The 10-year yield moved above 4.70% for the first time since early 2025, while the 30-year Treasury yield stayed above 5% for its longest stretch since 2007. Oil was the immediate driver, but investors were also focused on structural fiscal pressure and AI-heavy corporate supply. That is a very different rate environment from the post-GFC world, when low inflation, low productivity growth and abundant central-bank liquidity kept real yields suppressed.
The inflation concern begins with energy. Brent briefly pushed back above $100 as Middle East hostilities remained elevated and Red Sea disruption emerged as a second chokepoint alongside the Strait of Hormuz. Houthi attacks on Saudi tankers, disrupted Russian Black Sea exports, low inventories and rerouting risk across Hormuz, Bab el-Mandeb and Suez all raise the odds of renewed fuel-price pressure. Goldman Sachs still assumes de-escalation and a Q4 Brent forecast around $80, but the risk premium has clearly widened.
Tariffs are the second inflation channel. The White House announced new import duties of 10% to 12.5% on roughly 60 economies, with additional investigations under way involving China, Japan, Mexico and the EU. Separate 50% tariffs on some Canadian goods and 25% tariffs on many Brazilian imports reinforce the risk that trade policy will keep adding friction to the price outlook. Even if the effective tariff-rate impact is muted for now, the uncertainty increases the hurdle for the Fed to validate lower rates.
AI is the third channel and the most important structural one. Alphabet reported 82% year-over-year Cloud revenue growth, Cloud backlog grew by $50B quarter-over-quarter to $514B, and the company raised its 2026 capex forecast by $15B to a $200B midpoint, with 2027 capex expected to rise again. OpenAI reportedly lifted its pre-2030 compute budget by 25% to $750B, while Anthropic and AMD announced a 2GW partnership. These are powerful growth signals, but they also increase competition for capital, power, labor, equipment and grid capacity.
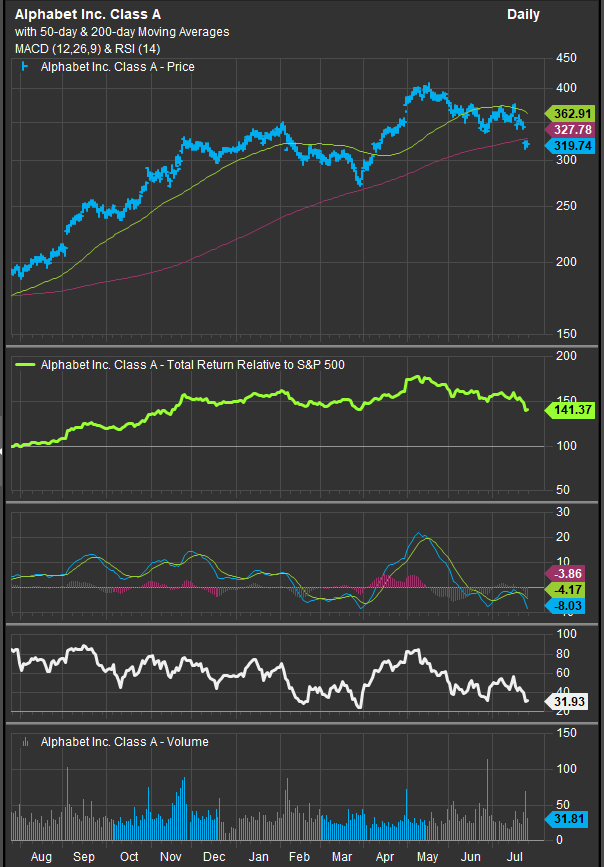
Chart: Alphabet co. has traded below its 200-day moving average as the challenge to the AI trade has brought the Mag7 trade to a bearish inflection point.
The International Energy Agency projects global data-center electricity consumption will rise to roughly 945 TWh by 2030, more than double 2024 levels. That helps explain why bond investors are reluctant to treat AI only as a disinflationary productivity story. AI may improve productivity over time, but the near-term effect is a capital-spending surge that tightens demand for electricity, semiconductors, memory, cooling, construction, financing and industrial equipment.
The growth side of the data also supports higher real rates. Initial jobless claims fell to 187K, the lowest level since 1969, while the four-week moving average dropped to 207.5K. July flash services PMI rose to 53.6, the highest level in eight months, while manufacturing stayed in expansion at 53.8. Employment rose after two months of declines, and business output expectations improved to an eight-month high. New home sales also beat expectations at 628K.
That growth resilience matters because real yields usually fall when the market starts pricing recession or aggressive Fed easing. The current data do not point there. Strong services activity, limited layoffs, positive earnings surprises and ongoing AI capex demand all give the Fed room to stay patient. Nearly 85% of Q2 reporters have beaten consensus EPS, and earnings surprises have been nearly 13% even excluding Google-related effects. That is not the kind of earnings backdrop that forces a major bond rally.
The main counterargument is the cooler June inflation data. CPI fell 0.4% month-over-month in June, the largest monthly decline since April 2020, helped by a 5.7% drop in energy prices. Core CPI was unchanged for the month and slowed to 2.6% year-over-year. That argues against a runaway inflation narrative and explains why 10-year breakevens remain anchored around 2.3%.
But the forward-looking data are less comfortable. July flash PMI reported the most severe supplier delays in nearly four years, input-cost inflation at a 14-month high, and selling-price inflation near a four-year peak. That combination—cooler backward-looking inflation but hotter forward-looking cost pressure—is exactly why breakevens can stay contained while real yields remain high.
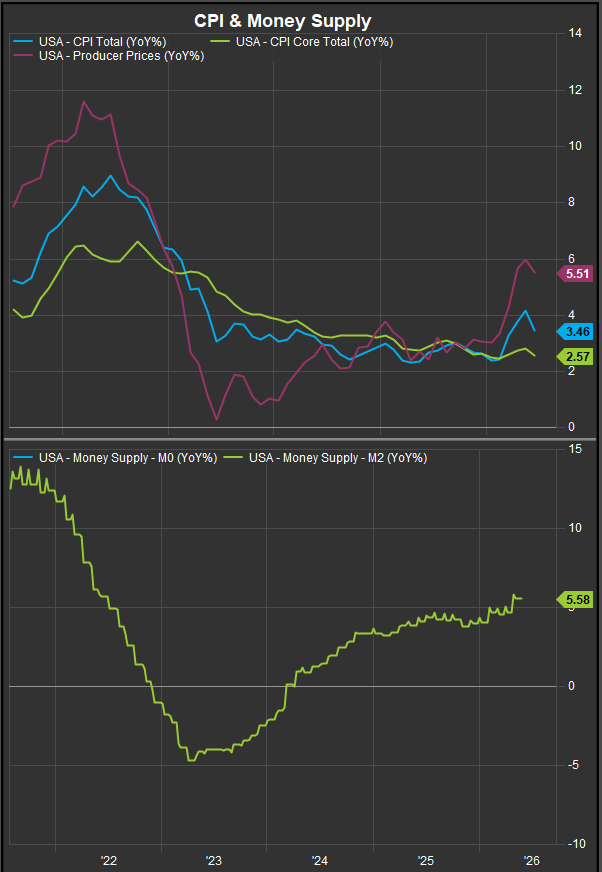
Chart: Upwards pressure on headline inflation inputs in 2026 have muddied the longer-term inflation picture even as core CPI continues to trend lower into 2026.
This answers the central question: the 10-year Treasury yield is not pricing more long-term inflation than the 10-year breakeven. It is pricing more inflation uncertainty, more real growth resilience, more term premium and more compensation for owning duration. The breakeven reflects the market’s average expected inflation rate over 10 years. The nominal yield reflects expected inflation plus real yield, supply-demand balance, term premium, liquidity preference and Fed reaction risk.
The data justify elevated inflation concern, but in a specific way. They justify a higher inflation-risk premium because oil, tariffs, AI capex, electricity demand and supply-chain delays all create upside risk around the path of inflation. The market can still believe the Fed will ultimately contain inflation while demanding a higher real yield until that path becomes clearer.
For investors, the implications are direct. Long-duration Treasuries need weaker growth, clearer inflation relief or a more dovish Fed signal before they regain durable leadership. TIPS still make sense as protection against renewed energy and tariff shocks, but the bigger opportunity in bonds likely arrives when real yields stop rising. For equities, high real rates continue to favor cash-flow quality, Financials, Energy as a hedge, and Industrials tied to AI infrastructure and power demand. They remain a headwind for speculative growth, expensive defensives and rate-sensitive assets that need a clean decline in yields.
The bottom line is that real rates are still doing the Fed’s heavy lifting. The combination of AI capex demand, resilient business cycles and continuing geopolitical risk have pushed longer-term inflation concerns to the center of the financial market discount mechanism. We think the next pivot for the AI trade will be defined by developments around inflation and the direction of interest rates. The present setup appears ominous if Growth and longer-duration assets, but investors need to keep in mind that geopolitical dynamics can shift quickly. Now that the AI trade has been discounted to oversold levels it sets up as a potential opportunity.
Sources
- FRED / Federal Reserve Bank of St. Louis — 10-Year Treasury Yield, 10-Year TIPS Yield and 10-Year Breakeven Inflation Rate — Used for the rate framework: 10-year Treasury yield at 4.71%, 10-year TIPS real yield at 2.43%, and 10-year breakeven inflation at 2.28% on July 23.
- Bureau of Labor Statistics — June 2026 CPI and PPI releases — Used for the cooler inflation evidence: CPI fell 0.4% month-over-month in June, energy fell 5.7%, and final-demand PPI fell 0.3%.
- International Energy Agency — Energy and AI — Used for the AI power-demand and capital-spending framework; the IEA projects global data-center electricity demand rising toward roughly 945 TWh by 2030.
Disclaimer: This material is for informational and educational purposes only and should not be considered investment advice, a recommendation, or a solicitation to buy or sell any security, ETF, bond, or strategy. Interest rates, inflation expectations, Treasury yields, commodity prices, and macro data can change quickly. Past performance is not indicative of future results. Investors should consider objectives, risk tolerance, liquidity needs, and consult a qualified financial professional before making investment decisions.
