July 20, 2025
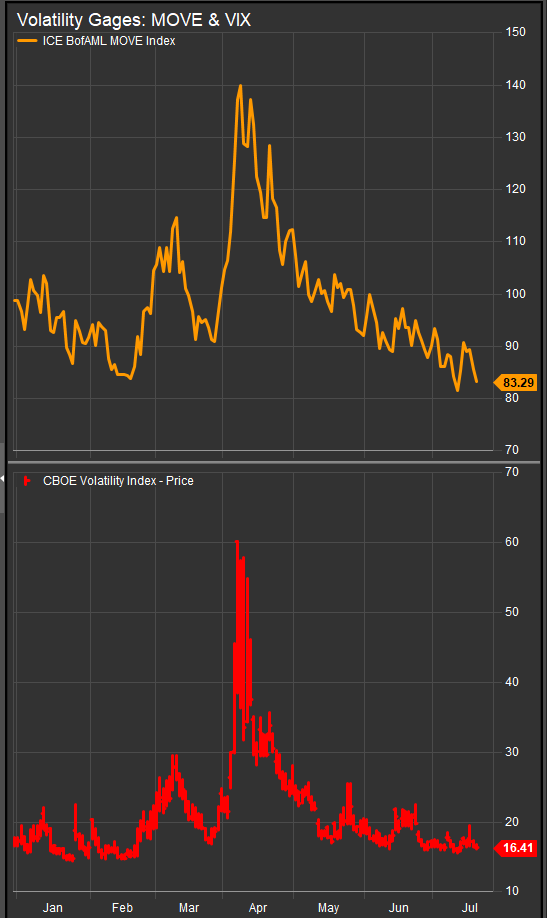
As July ticks on with equities sitting near all-timer highs, there’s a temptation to worry. The volatility of March and April has subsided with the VIX and MOVE indices for equity and bond volatility retracing to pre-decline levels (chart below). The sharp rotation into min vol. stocks, bonds and ex-US equities has subsided.
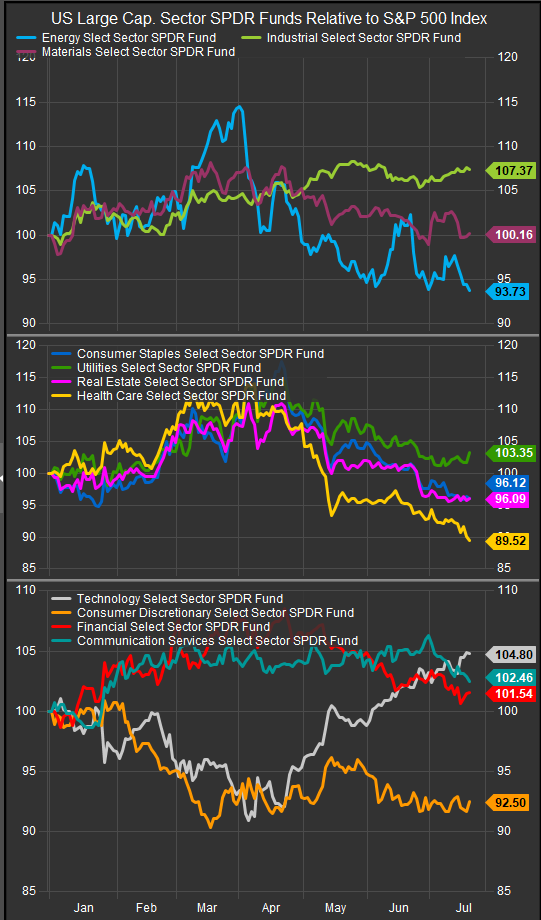
Tech stocks are again leading at the sector level (chart below), and min vol. sectors which outperformed by double-digits through the end of March are now making new relative lows for the year. Those tempted to worry will call this complacency. We won’t argue, but we will note that while market corrections often happen against a backdrop of low volatility, that is also the backdrop for sustained bull trends that make longs a lot of money.
A resilient bull market is an interesting thing. The more equities demonstrate an ability to rise despite potential threats to the business cycle, to supply chains, to higher interest rates, and Geo-political complications, the higher confidence rises as the crowd gets behind the trend. We have all just witnessed an almost 20% peak-to-trough decline from late February to early April. The threat of rapid global trade realignment under potentially punitive terms was enough to condense the fear of a cyclical bear market into 5-weeks of strong selling. What we need is a way to get an idea of buying enthusiasm. Technical analysis can help us get a sense for the strength (or weakness) of the buyer when conditions are benign, but forward prospects are somewhat uncertain.
As equities consolidate near all-time highs its worth pointing out that the Q1 decline had many characteristics of a market clearing event. The 4-year chart of the S&P 500 (below) shows us some very interesting facts about our behavior in March. As a group, we equity investors managed to retrace the entirety of the bull market gains to within basis points of the January 2022 high, the peak of the previous bull market. Investors also managed to register the deepest oversold conditions since that early 2022 peak.

When we look at the internal strength of the S&P 500 trend (chart below, lower panels), we can see an expansion in the % of stocks that have been able to move above their 50-day moving average. That series has touched 80% three different times since equities made their April lows, and the longer-term series is retesting its previous highs. The bottom panel shows the percent of constituents advancing and declining on a given day. When >90% of stocks in a broad index like the S&P 500 are trading in the same direction on the same day it is a notable sign of crowd behavior called capitulation. Typically, durable lows in the equity market come with a cluster of >90% up and/or down days. We had 4 such days in April. That’s one technical indicator that conditions for a stronger longer uptrend are set.

These are important series, as they help us get an objective measure of buying enthusiasm. As earnings outlooks get a little cloudy with analysts evaluating global trade implications and the Fed pondering its next steps on policy against a backdrop of lower volatility in the near-term, “buying power” is a key driver of returns. With rates moving sideways and global equities moving higher together, market internal strength is an indicator of the latent optimism (or pessimism) the crowd has for stocks. Referring to the chart above, if the % of stocks trading above their 50-day moving average moves below 60%, that would be an indication that investors are losing their optimistic outlook and chances of a seasonal correction are more likely.
Patrick Torbert, Editor & Chief Strategist, ETFSector.com
Data sourced from FactSet Research Systems Inc.
