March 16, 2025
The S&P 500 hit the 10% correction threshold on Thursday March 13 as the buyer finally stepped in to health the sell-off on Friday. In the previous 3 weeks US equities have transitioned from global leaders to laggards. The USD has executed a sharp pivot lower vs. the Euro and major currency baskets as US Yields have moved lower as well.
The chart below shows the S&P 500’s relative performance vs. the MSCI All Country World Index ex-US. Performance pivots at the beginning of November and now approaches par vs. RoW.
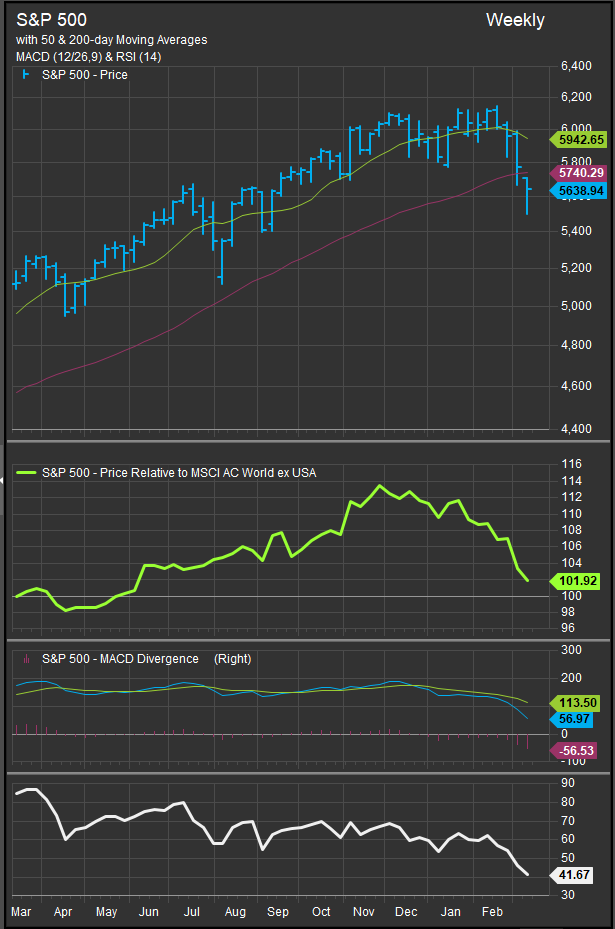
The S&P 500 is near-term oversold, and we are expecting an attempt at a rally this week, but the negative divergence in momentum that preceded this correction implies waning enthusiasm and we expect prices needed to move lower to clear the weak holders and establish a durable accumulation point for the bull market to resume.
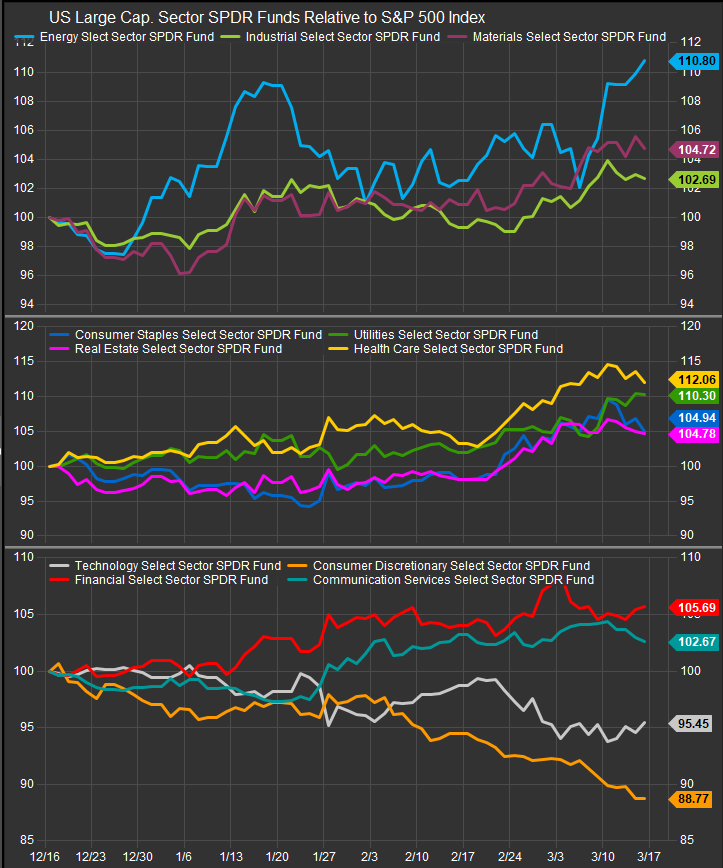
Sectors Show the First Wave of Defensive Rotation is Over
Our sector performance chart shows a momentary pause from the rush into defensive sectors in February. There’s some testing in to discounted Tech Sector shares (more on that later), but Discretionary stocks continue their recent nosedive. The Energy Sector has bounced from the recent OPEC supply announcement, and we wait to see the market’s next step.
A Duel of Champions?
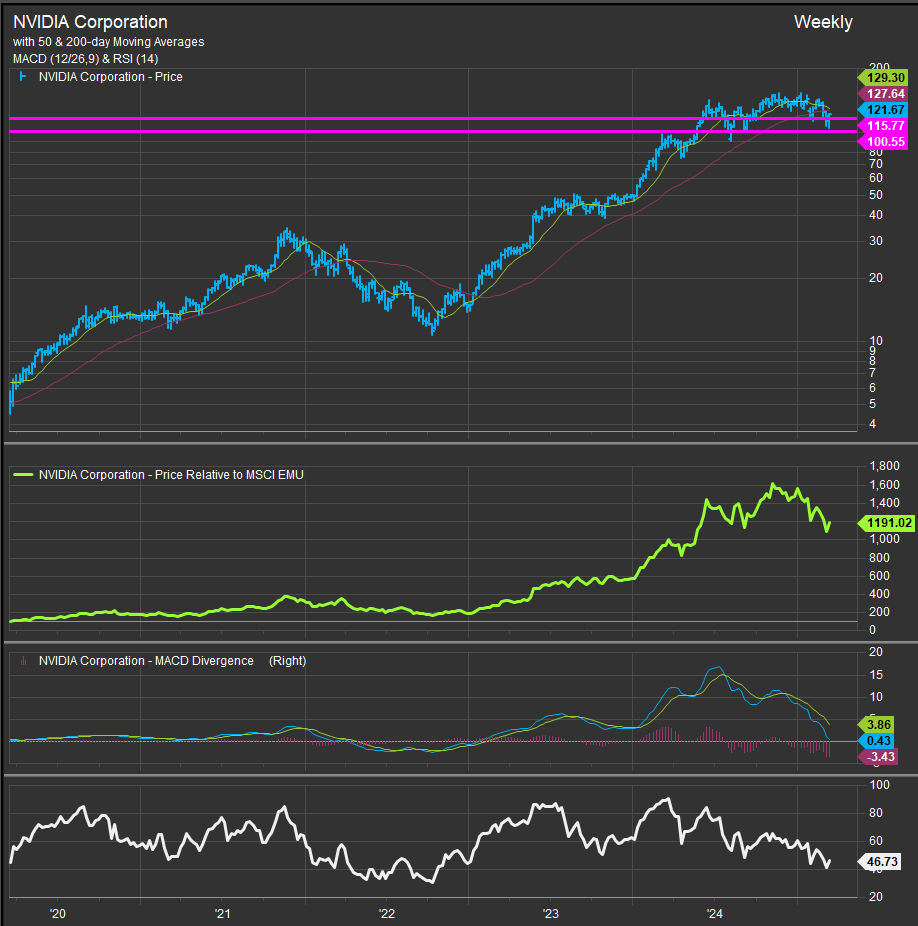
The bull market of 2023 and 2024 is now called into question by near-term corrective action, tariffs, uncertain interest rate policy and some level of concern that the US economy could slip into recession. This bull market has been characterized by Mega Cap. stock leadership and the MAG7 cohort. However, no stock sits closer to the flame than NVDA. Still identified by many as the beating heart of the AI trade, NVDA’s stock is now in a precarious position. The stock has recently retraced almost 40% of its all-time price and continues to exhibit distributional technical attributes even as its break-neck fundamental Growth is eclipsed by our optimistic expectations.
The chart below highlights our key support zone for NVDA between $100-115. Price has bounced on its first test near that $100 level and cleared the top of the zone, but failure below $140 keeps the chart in a distributional price structure which implies deeper correction with potential to hit $50
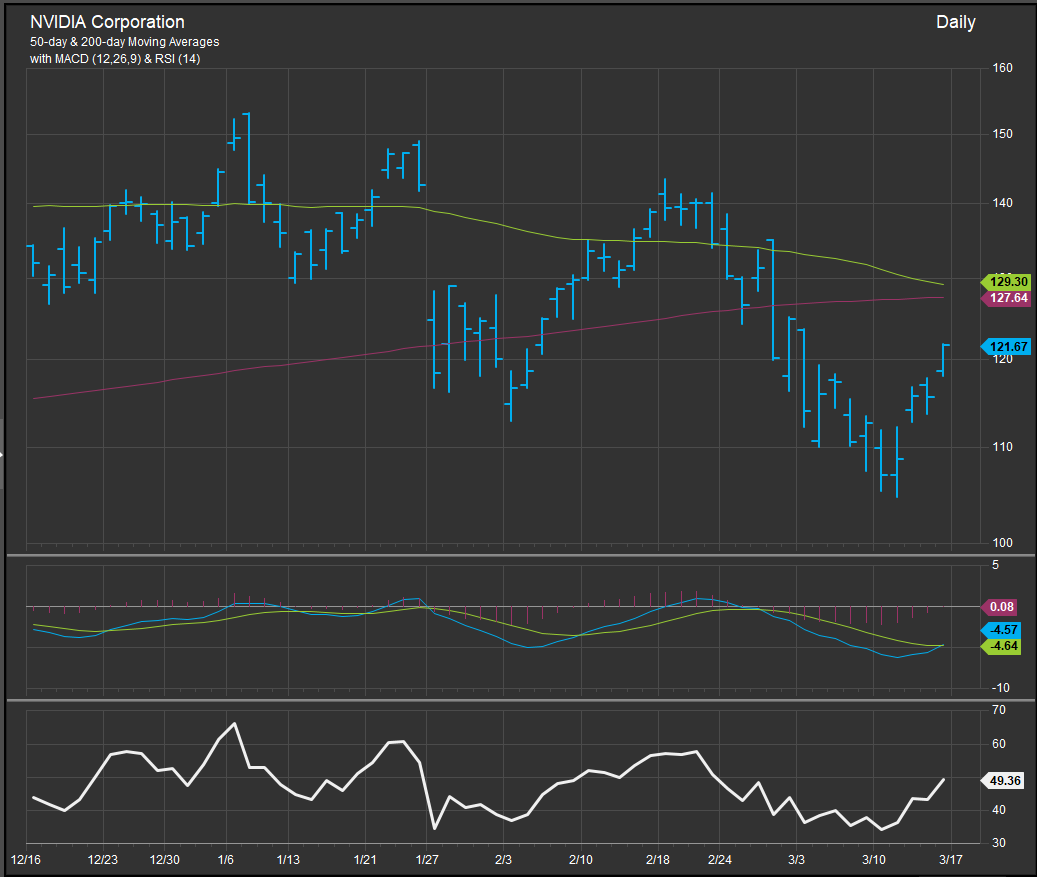
The short-term chart presents 50-day and 200-day moving averages functioning as tells for this pivotal move in the stock. Their convergence at the $128 level will be an important test for the buyer this week.
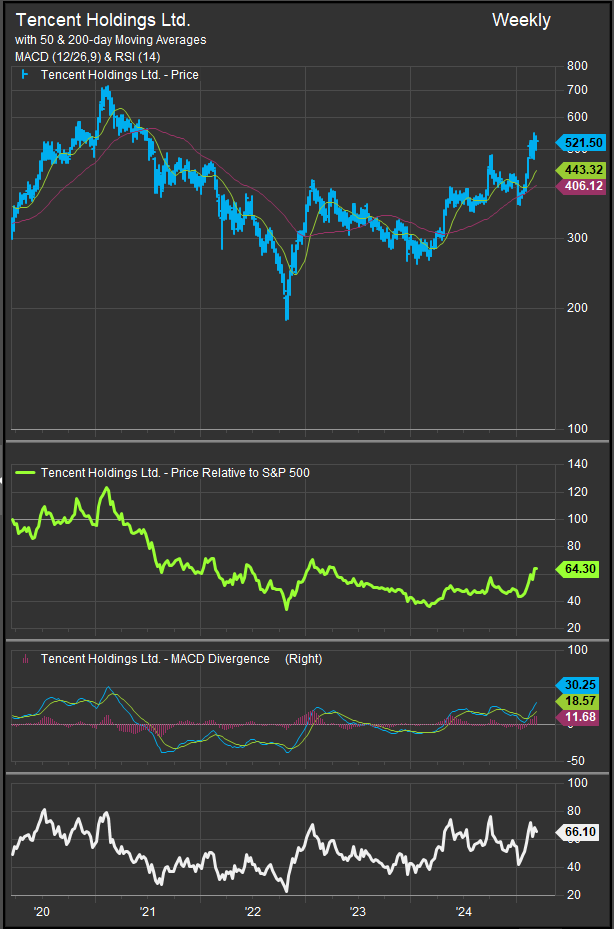
But we mentioned a duel. We would point out that as the NVDA chart has been slowly but steadily rolling over into a potentially distributional situation, former champions of overseas Growth have been basing out and forming long-term bear to bull reversal patterns; Tencent and Alibaba are back, and they are attracting capital. The charts below show multi-year declines into bullish pivots for both Chinese e-commerce giants. Chinese economic reforms were celebrated in September, but lack of follow through for several months kept us skeptical. Now, with cracks in the narrative of US Tech supremacy there is an opening, and investors are warming to it.

Psychological Significance
We are willing to bet that NVDA is a very important stock to the psychology of the stock market. How it acts as it trades into the major moving averages will be an important “tell”. Failure for the stock is likely failure for the entire Growth trade in the near-term. Chinese and German stocks have been standouts during the recent rotation and international stocks in general have been beneficiaries of concerns about US Growth. NVDA remains a key bellwether.
Patrick Torbert, Editor & Chief Strategist, ETFSector.com
Data sourced from FactSet Research Systems Inc.
