April 13, 2025
Equities continue to swing on developments around global trade policy. This past week saw the Trump Administration take its first steps towards outlining parameters for compliance with its policy goals. Concessions around computers and Smart phones, rollbacks of higher rates for countries that have offered to cooperate and very high rates for China which has remained adversarial sum up the week’s news-y developments. US equities authored their own positive response with a top-5 all-time single day up move on Wednesday, April 9 for the S&P 500 which came on record volume. The price action and news flow offered the first developments that the bull can grab onto as this market level correction has unfolded. We think the technical setups offers clear contours for interpreting price signals as we move forward.
Technical setup for the S&P 500 shows Clear Support and Resistance
Our 4-year weekly chart of the S&P 500 (below) shows the intra-week low for the current equity correction hit the level of the index’s 2022 price high in early 2022 almost to the penny. Long-term price highs (and lows) often function as important psychological levels for the stock market. In this case the corrective action in 2025 expressed doubt on narratives around the universal benefits ascribed to AI as well as the “Soft Landing” narrative around inflation easing and the Fed’s ability to support main street without its re-emergence. We think that 4818 level is likely to be support for the corrective move and we would expect positive momentum divergence to develop as price retests that area in the near-term.
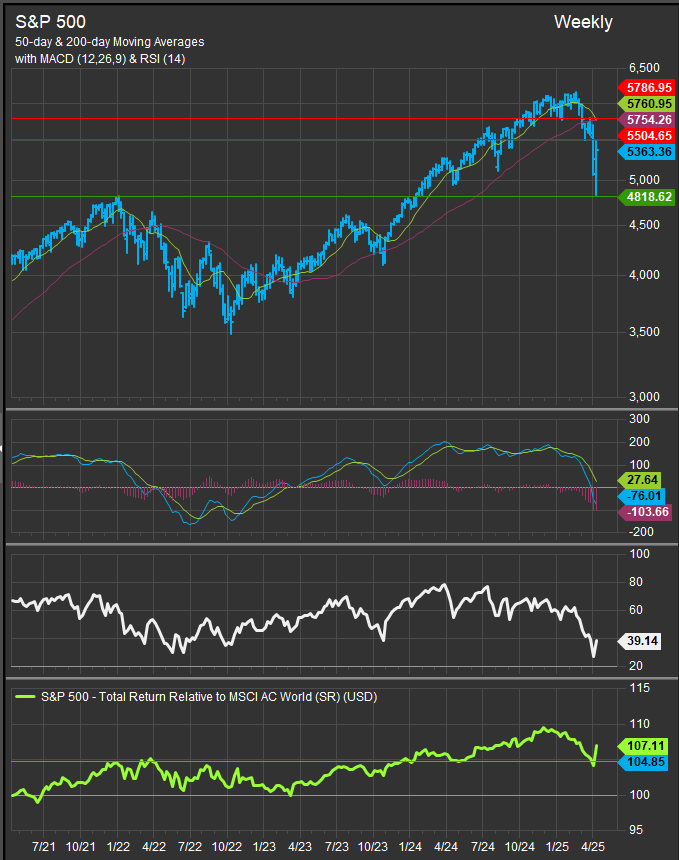
Regarding overhead resistance, referring to the same chart above, we think 5504 is an important near-by level for the buyer to regain this week and our bullish reversal signal comes in at the 5786 level which is just above the S&P 500’s 50-day and 200-day moving average.
The bottom panel on the chart shows The S&P 500’s relative performance vs. the MSCI All-Country World Index. This ration offers another barometer for the tariff trade. Investors have shown a willingness to move money overseas when the rhetoric from the Trump Administration gets too aggressive, but there is a sharp rotation to re-shore that capital when conciliatory developments have materialized. With the nature of the conflict seemingly shifting to more of a duality between the US and China, it will be interesting to watch this dynamic.
Chinese Shares are at a Significant Pivot Point
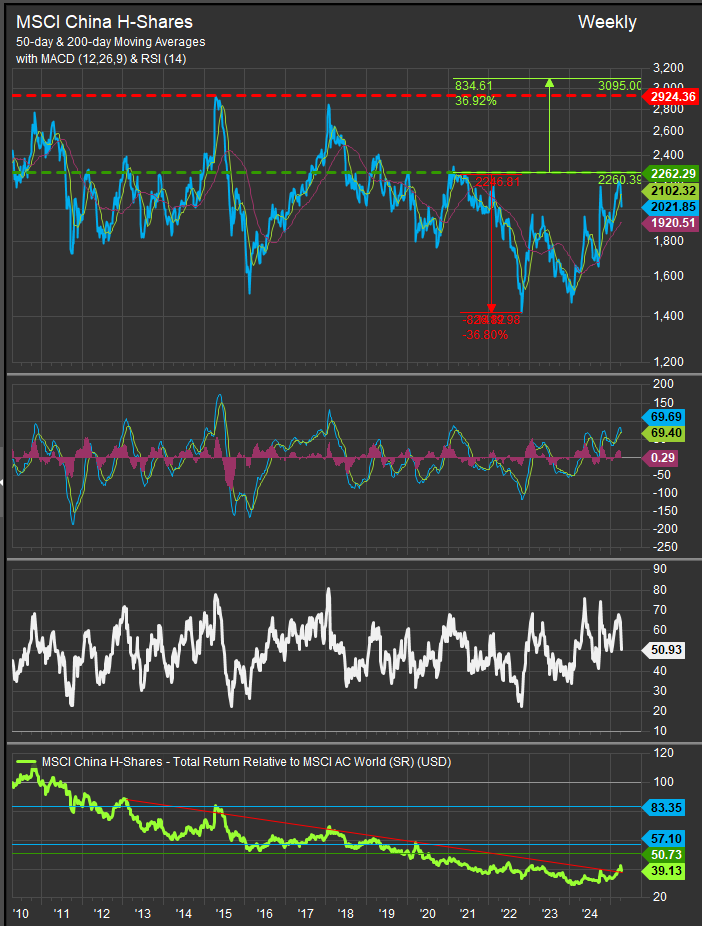
The chart below shows Chinese H-shares (Hong Kong Listings) over the past 15 years in absolute terms and relative to the same MSCI All-Country World Index. Our key takeaways from this chart are price approaching a long-term resistance zone that has been a delineator between pedestrian and significant rallies in Chinese shares. Historically Chinese shares have traded in a sideways mean-reverting pattern as the chart shows. In periods of elevated interest the H-Shares rally through the 2250-2300 level and typically see shares top out an additional 20-25% higher. The last time this happened was 2018. At the risk of stating the obvious, at the high end of the range on the chart it’s usually time to sell. However, the technical setup as price approaches this historical pivot is favorable and a break-out above 2262 would be technically significant implying a target just above the top end of the historical range for H-share prices.
Growth vs. Value is also at a Pivot
Growth vs. Value is also at an important line of demarcation. Growth investors have entered the market on relief that smartphone and computer supply chains will be exempted from the current tariff battle. Growth factor performance is likely to be coincident with US outperformance vs. Rest-of-World. If we see Value factor exposure outperforming, that is a key that corrective action remains at the forefront of investor’s minds as Value stocks are a relative beneficiary of inflation dynamics. The chart below shows Growth bouncing in the near-term after Value had closed the near-term gap in performance.

As we’ve mentioned in the past the Value factor generally encompasses both Min Vol. stocks and Commodities related stocks. Downstream effects of a trade war include the disaggregation of integrated global supply chains and the decrease in the flow of the means of production across geographic borders. Conceptually this increases the need for logistics and infrastructure as supply chains need to become regional and barriers to the movement of goods create scarcity. All of these aspects are potentially inflationary and are a tailwind to the prices of basic material input costs. Reconciliation likely comes with shares reflating with higher probabilities of continued economic expansion.
Conclusion
Despite some positive developments on global trade, equities still face a tricky scenario. Interest rates have moved higher with equities bouncing complicating the idea that interest rates will be a potential source of relief for the consumer. We think the price action on the S&P 500 established the 4818 level as likely support for ongoing consolidation while 5786 is our bullish reversal threshold for the index. Performance of Growth vs. Value will be a key tell as to how investors are viewing the markets forward prospects. Growth outperformance signifies a positive resolution is expected, while Value outperformance would presage an inflation or recessionary scenario.
Patrick Torbert, Editor & Chief Strategist, ETFSector.com
Data sourced from FactSet Research Systems Inc.
