June 22, 2025
The S&P 500 has been consolidating for two weeks. Prices remain above our neckline of 5786 (chart below) which keeps the most aggressive upside scenarios on the table from a technical perspective. 5504 remains our accumulation point on any deeper drawdown.

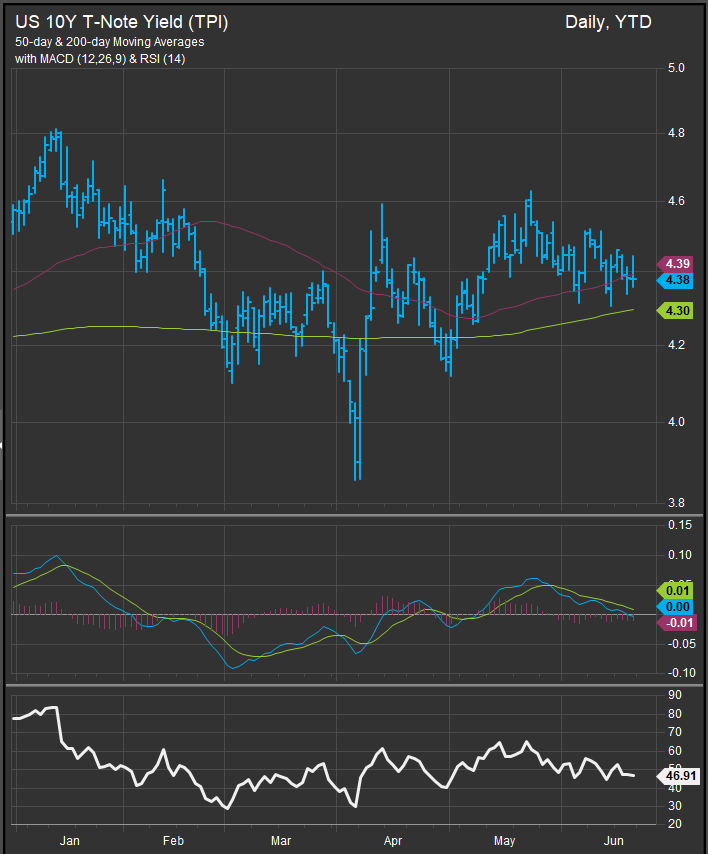
While investors look for resolution from the S&P 500’s near-term consolidation, we’re getting somewhat contradictory signals from commodities prices and rates. Both the 2yr and 10yr yields have moved lower in the near-term while commodities prices have moved higher, driven by a surge in oil prices.
The 10yr Yield (chart below) has support at the 4.14-4.2% level and we aren’t expecting a move below unless economic data weakens materially from present levels.
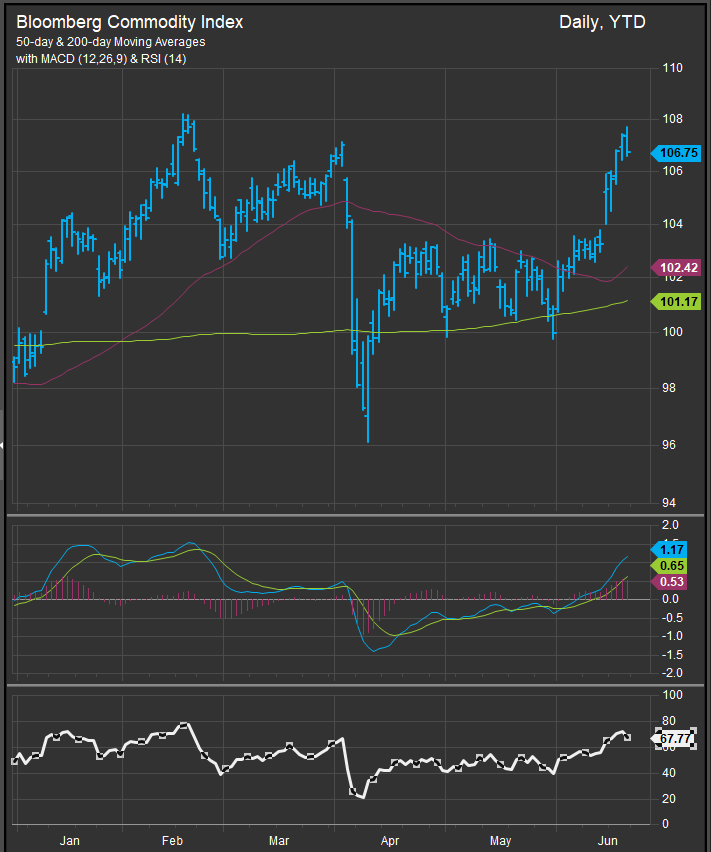
However, downward pressure on yields have us expecting commodities prices are likely to roll over sooner rather than later. The Bloomberg Commodities Index (chart below) charts significant longer-term resistance at the 108 level. Equity buyers have caught the jitters at this level at previous points in the cycle and pressure has then come off. With the BCOM hitting an overbought reading on Wednesday June 18, commodities prices may be due for some consolidation.
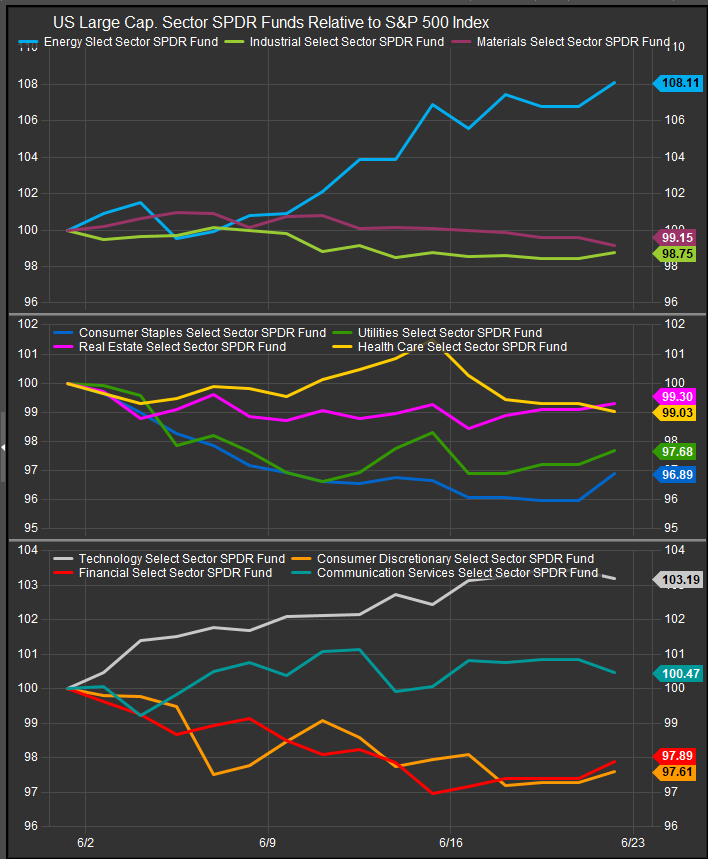
If commodities prices do end up rolling over from current overbought levels, we’d expecting bullish sector exposures to resume outperformance to the upside. Despite falling yields, defensive sectors (chart below, middle panel) have been met with a cool regard. MTD Energy and Technology shares have led while a mix of lower vol. and cyclical exposures have retraced gains from earlier in the year (chart below).
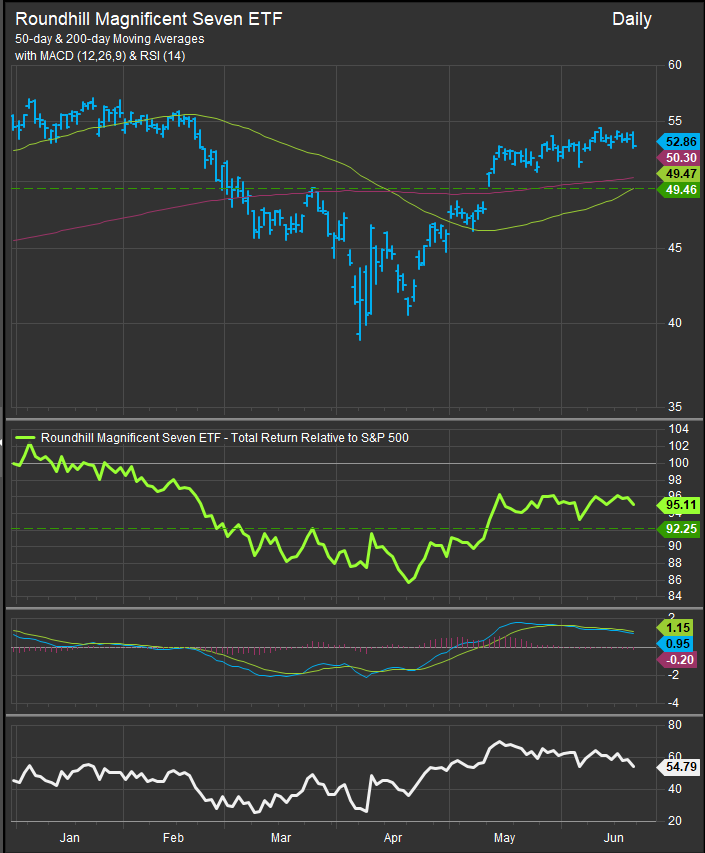
Our bull thesis relies on the continued moderation of inflation pressures and interest rates remaining mid-4% and below so the US consumer can stay in the game. Bull market stalwarts like Mag7 and semiconductors (charts below) are holding up their end of the bargain, though the rock-solid performance of the former is fraying as AAPL and GOOG come under pressure.
Roundhill MAG7 ETF
SOX Index

In any extended bull market, there is a longer-term leadership rotation. We’ve seen housing and retail lead and then fade in this cycle. Banks did some reflating in late 2024, but they’ve paused again. Industrial stocks have perked up in 2025 and AI remains the thematic backbone of this bull market. When we look at internal trends for the S&P 500 we can see that the current reversal has more work to do as only 54% of stocks have managed to move above their 200-day moving average since the early April lows (chart below). We need to see more to build conviction. Per the chart (middle panel, blue line) we need to see the %-above 200dma series move above 62% on its way to a reading >85% to reconfirm the cycle.
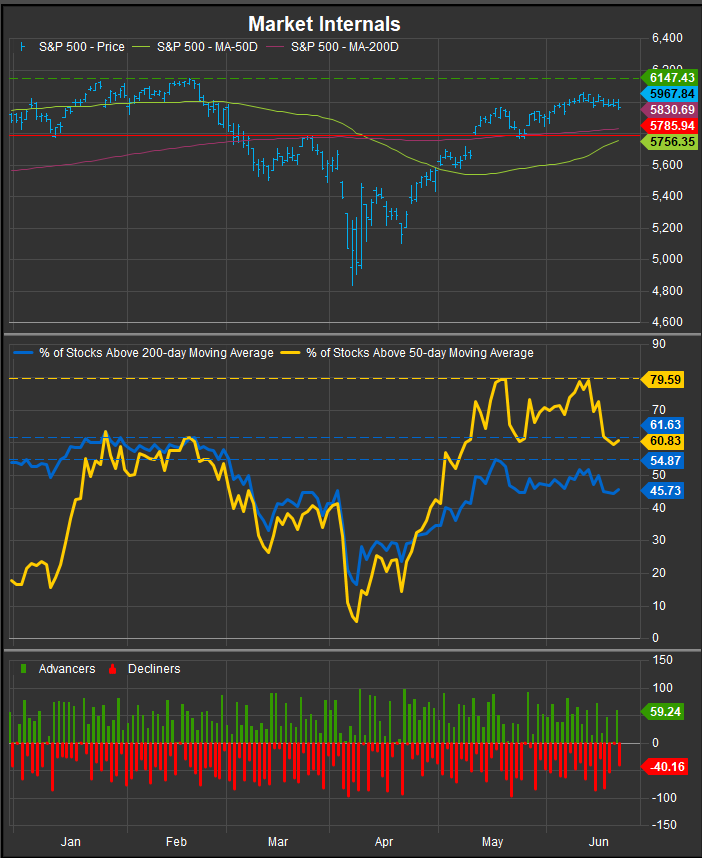
Overall, we are in the crucible of a nascent bullish reversal amidst a complicated geopolitical backdrop. We remain constructive on the market from a technical and macro perspective. Rising input prices aren’t being seen as longer-term inflationary and we are expecting some bullish resolution given softening rates. Market internals for the S&P 500 aren’t particularly strong, but they haven’t triggered our sell signals either. We remain on the lookout for bullish accumulation opportunities at the index level.
Patrick Torbert, Editor & Chief Strategist, ETFSector.com
Data sourced from FactSet Research Systems Inc.

