We want to continue to focus on the macro picture and its implications for sector selection and positioning in this week’s letter. In last week’s letter, we talked about the potential for rates and commodities prices to bounce higher with the Fed delivering a 50bp cut to its policy rate. A week later we have seen that price action manifest. From the lens of our GICS Sectors, this has played out over the past 3-months primarily as a push pull dynamic between historically lower volatility, income generating sectors Staples, Utilities. Real Estate and Healthcare and commodities adjacent sectors like Industrials, Materials and Energy. Perhaps not surprisingly, the sectors that animated much of the longer-term bull trend, Technology and Comm. Services have been in consolidation over this period with the former retracing gains from earlier in the cycle and the latter pushing sideways.
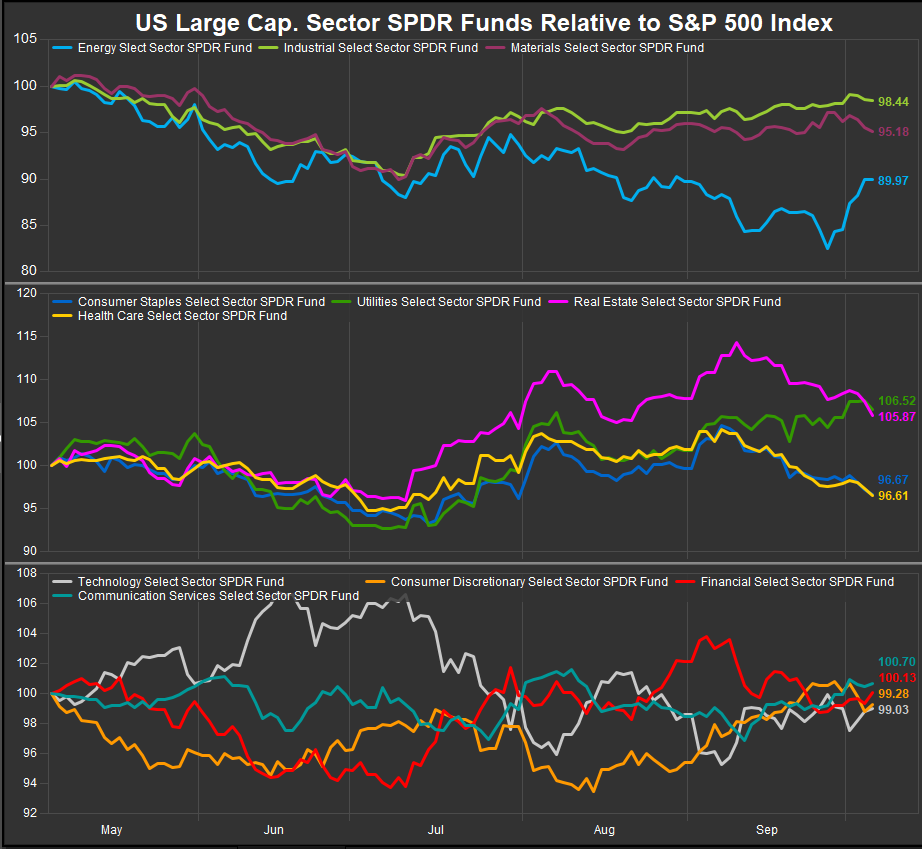
In the near-term Energy sector shares have surged. However, an evaluation of longer-term timeframes shows the move is shy of a clear bullish reversal. A look at the preceding 5-month of sector performance (chart below) shows the rotation. In the top panel we see the Energy Sector advancing and closing the gap with Industrials and Materials sectors which have been steadily firming since early July. Real Estate, Healthcare and Staples sectors are bearing the brunt of poor performance. From a tactical trading perspective our Elev8 model would cover it’s short in Energy and fund it with a more to a zero-weight position in the Real Estate Sector. This would be triggered by continued strength in Crude and Energy stocks in the coming week.
The Elev8 model has us allocating our largest active exposures to Growth aligned sectors at present. We consider the multi-month consolidation in Technology Sector shares to be an accumulation opportunity within the context of a longer-term bull trend. We set expectations based on a rigorous evaluation of price and yield trends across the financial markets to hone our edge. We saw an example of this in action as the S&P 500 reconfirmed its bull market with new all-time highs in September and bullish payroll reports hit the tape at the end of last week. We don’t have an edge on the latter beyond trading with the message from the former. Within the contours of that process, we continue to be aligned with historic beneficiaries of upwards trending equity markets, Technology, Financials, Discretionary and Comm. Services. We have flipped our largest short exposure to min vol. and defensive sectors from Commodities adjacent sectors. Crude prices and interest rates remain pivotal factors to watch this week.
–Patrick Torbert, CMT | Chief Strategist, ETFsector.com
Sector ETF’s/The Week in Review
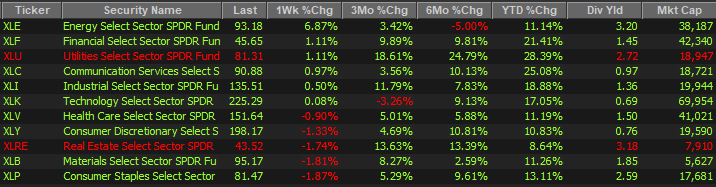
Using the Sector SPDR Funds as proxy, we see the Energy Sector’s strong week, with shares gaining 6.87% in aggregate. Financials, Utilities, Comm Services, Industrials and Technology shares also finished positively. Staples, Materials and Real Estate were the biggest laggards while Healthcare and Discretionary stocks also moved lower. On a week where the S&P 500 closed at an all-time high, the rotation confirms a more bullish message. Combining the charts and the economic data, we see investors expecting a strong jobs report and expanding services PMI’s as more likely to lift fading industrial manufacturing gages.
Casting our eyes further afield to national and global events, we see escalating war in the Middle East as well as the realization of utter catastrophe in the Southeastern US. Both events contribute to near-term pressure on commodities prices as they disrupt domestic and global supply chains and consume raw materials for rebuild, recovery and re-supply efforts. These can be bull market or bear market catalysts depending on the direction of interest rates and the relative stability of prices. This is why we advocate for the market trend as a determining signal.
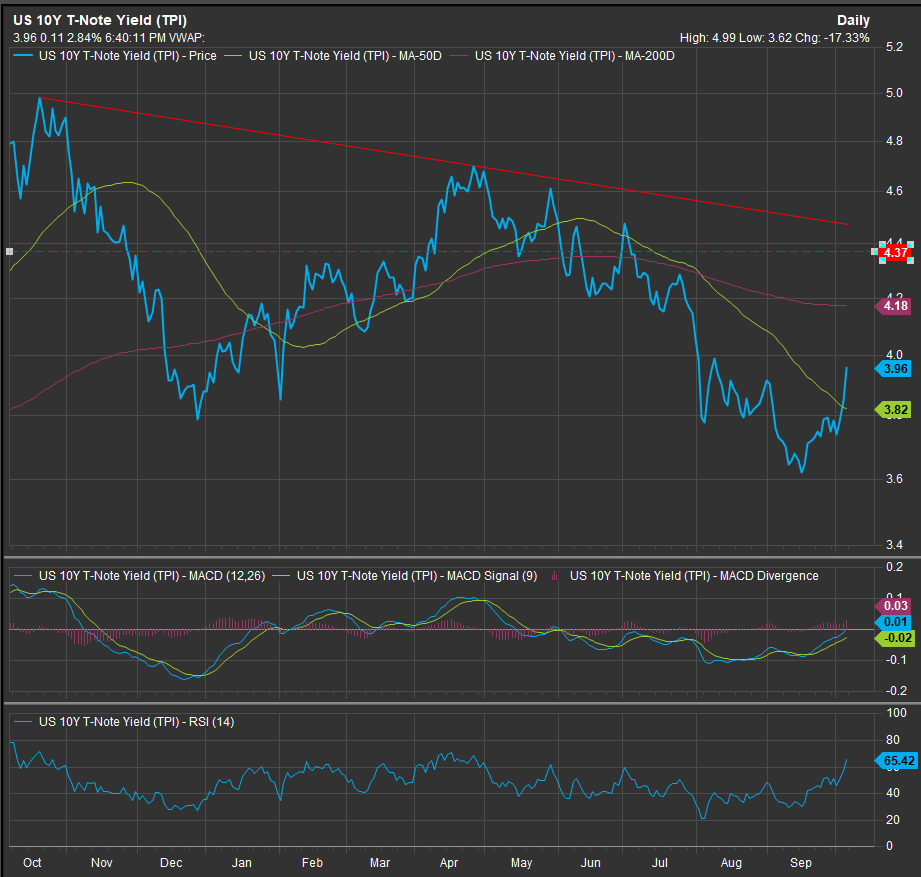
The US 10yr Yield is at near-term resistance near 4.00%
The chart below shows the US 10yr yield YTD. With the yield backing up to near-term resistance near 4%, the next upside objective comes into focus. There is potential for the yield to move to the 4.37-4.5% zone to be the next prominent resistance point for the 10yr Yield on a move higher. We want to see that up-thrust above 4% as our signal for trend change in yields over the intermediate-term.
Commodities Prices Nearing Resistance
The Bloomberg Commodities Index (YTD price chart below) has rallied from an oversold level at 94 to the 102 level. We have gone long the XLB to cover some of our portfolio level short to commodities exposure as a response to this nascent bullish reversal. Our MACD momentum gage has shown a strong buy signal and near-term bullish trend change for the index.
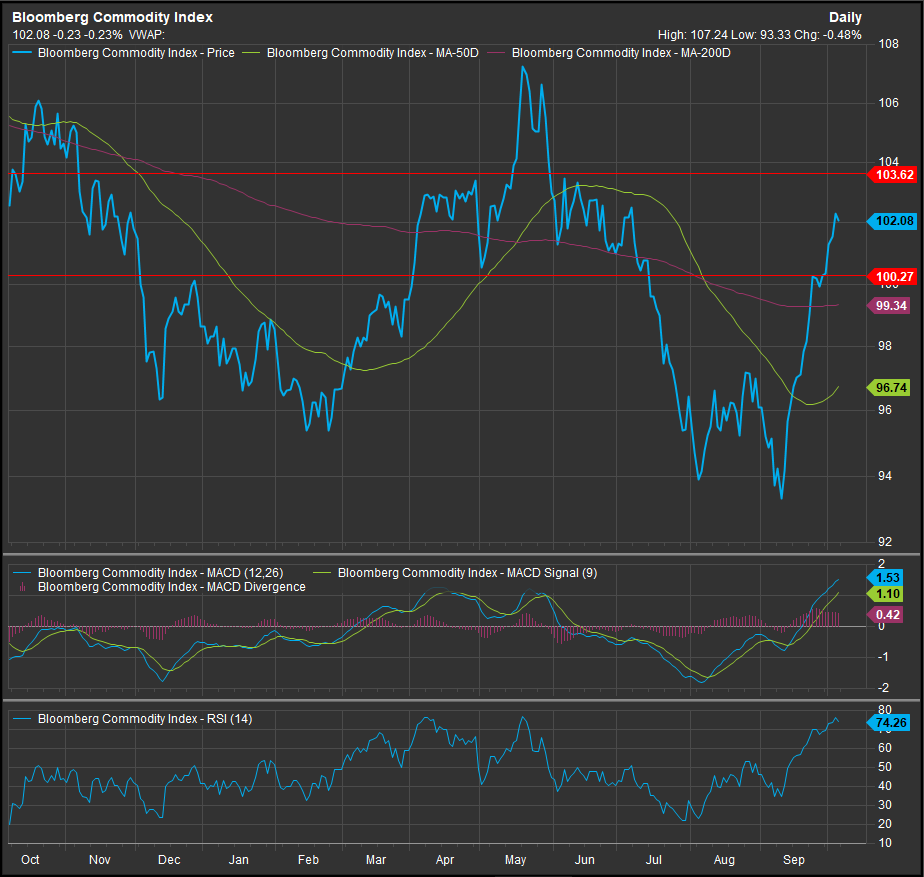
However, our approach is about aligning with the strongest longer-term trends and the 3year chart of commodities prices (below) is still firmly in downtrend territory. It would need a move above the longer-term congestion zone to change trend. The important level on the chart is 107. The next consolidation in the price should give us a clue to the durability of this move higher. Confirmation in the near-term comes above 103.
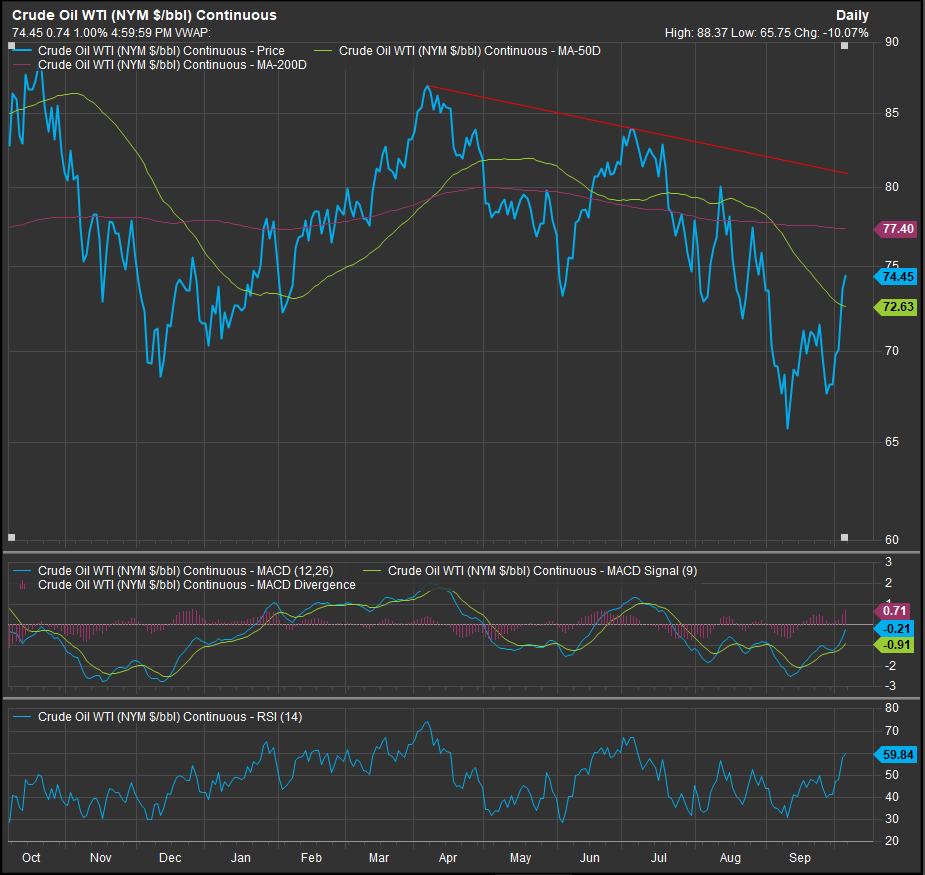
Crude Prices Firming, $80 a key pivot on the chart
Crude prices took out $72 on the way to $74 this week as measured by the WTI continuous contract. The chart below shows the downtrend channel resistance line converging on near-term horizontal resistance at the $80 level. That is our important pivot point for this potential bullish reversal.
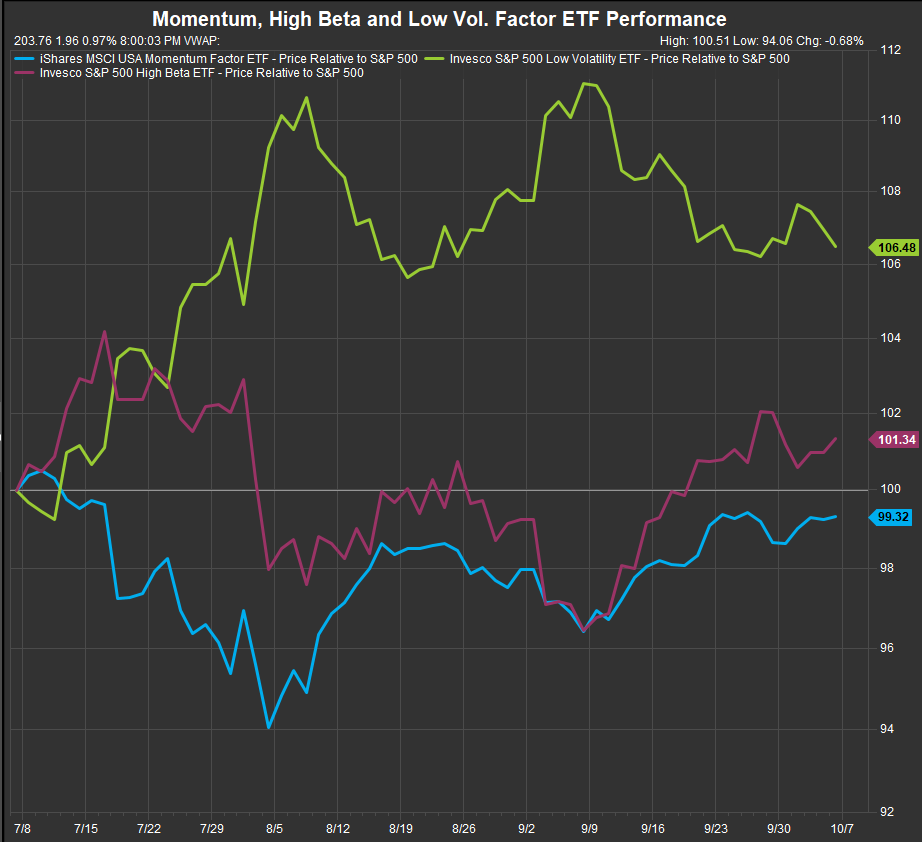
Factor ETF’s show Risk-on Performance firming vs. Risk-off
At present, a look at factor ETF’s shows the iShares Momentum ETF and the Invesco High-Beta ETF firming while the Invesco Low Vol. ETF consolidates near October lows. For the time being this confirms our bullish positioning. We look to risk gages of this type to determine investor sentiment and conviction. The current picture remains constructive for the bull trend in US equities despite some challenged circumstances.
Source: FactSet Research Systems Inc.
