


January 2, 2026
An ETFSector.com Sector Fund Universe Review
At ETFSector.com our research encompasses major US sector fund families as well as industry and niche funds that are organized along the GICS structure. In all we curate a universe of more than 150 funds to bring insights to sector investors.
Sector ETF performance in 2025 appeared strong at the headline level, but the true drivers of return were far more structural than cyclical. While most broad sector ETFs posted positive results alongside the broader equity market, performance was dictated by concentration, capital intensity, and exposure to a narrow set of dominant earnings engines. Funds that held heavier weights in AI infrastructure, defense, and commodity-linked industries captured outsized gains, while those with broader or more diversified exposure diluted their upside. Within ETFSector.com’s Sector Fund Universe, 2025 ultimately became a case study in how index construction and holdings composition mattered more than sector labels themselves.
Broad Sector ETFs: Capturing Beta, But Not the Full Opportunity
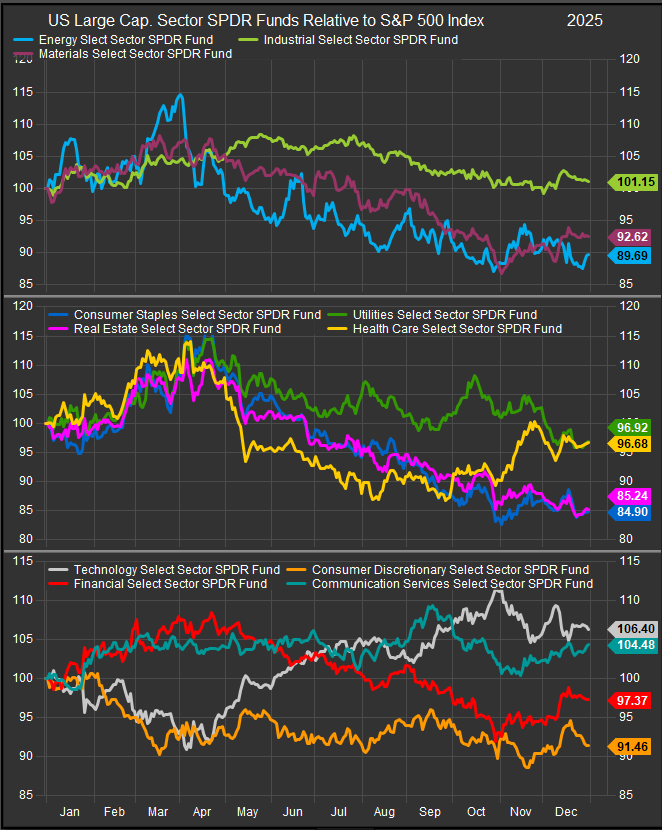
At the broad sector level, performance closely followed the distribution of earnings growth and capital spending across the economy. Technology and Communication Services led because these sectors contained the largest share of companies benefiting directly from AI monetization, digital advertising recovery, and platform-scale economics. Industrials followed closely, reflecting exposure to aerospace & defense, infrastructure, and reshoring-related investment. Utilities and Financials benefited later in the year as interest-rate pressures eased, improving valuation support for capital-intensive and rate-sensitive balance sheets.
By contrast, sectors with more diversified or defensive earnings profiles lagged. Consumer Staples and Real Estate struggled because their holdings offered limited earnings acceleration in a year where equity drawdowns were shallow and brief. Energy underperformed despite periodic geopolitical support, as oil prices declined and many integrated producers and E&Ps failed to generate operating leverage. In these sectors, diversification across slower-growing constituents acted as a drag rather than a benefit.
Sector SPDR ETFs – 2025 Total Return
| Sector | Ticker | 2025 Return |
| Technology | XLK | 24.3% |
| Communication Services | XLC | 23.0% |
| Industrials | XLI | 19.2% |
| Utilities | XLU | 15.9% |
| Financials | XLF | 14.8% |
| Health Care | XLV | 14.3% |
| Materials | XLB | 9.9% |
| Energy | XLE | 7.8% |
| Consumer Discretionary | XLY | 7.3% |
| Real Estate | XLRE | 2.6% |
| Consumer Staples | XLP | 1.5% |
These results highlight an important feature of 2025: sector-level diversification limited upside in a market dominated by a handful of exceptionally strong earnings contributors.
Broad Sector ETFs Across Families: Construction Mattered More Than Labels
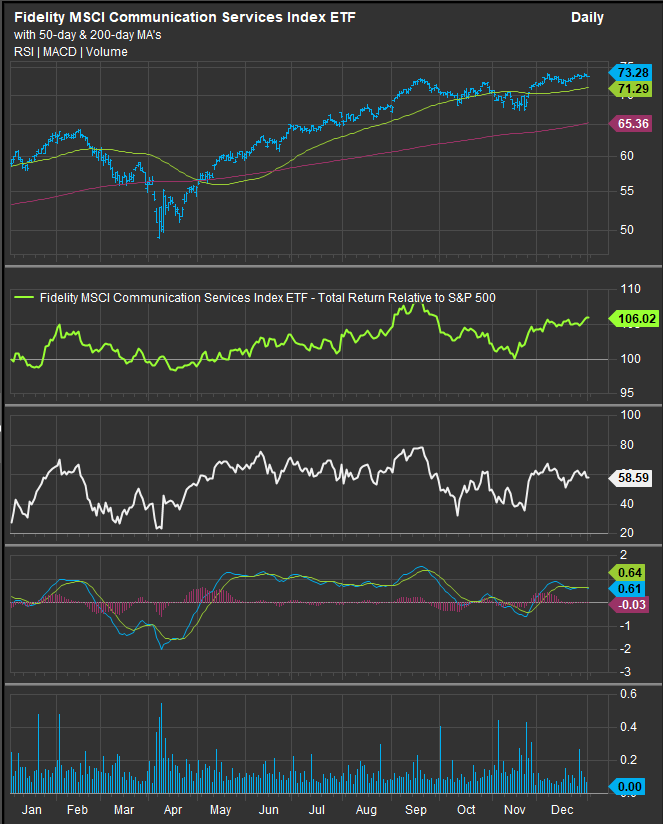
When examining the top-performing broad sector ETFs across all fund families, differences in outcomes can largely be traced back to index breadth, constituent inclusion, and weighting schemes rather than branding. Funds that outperformed within the same sector tended to include a broader opportunity set or higher weights in the largest, fastest-growing companies. In Technology, for example, funds with greater exposure to software, IT services, and diversified hardware captured additional upside during periods when leadership rotated within the sector. In Communication Services, broader inclusion of internet platforms and digital media names boosted returns relative to more narrowly defined benchmarks.
Importantly, these advantages were incremental rather than transformational. The performance spread among broad sector ETFs was measured in low single-digit percentage points, underscoring that sector beta was the dominant driver, with construction details acting as a modest performance modifier rather than a source of true alpha.
Top 10 Broad Sector ETFs – All Fund Families (2025)
| Rank | Ticker | Sector Focus | 2025 Return |
| 1 | FCOM | Communication Services | 25.9% |
| 2 | IYW | Technology | 25.3% |
| 3 | XLK | Technology | 24.3% |
| 4 | XLC | Communication Services | 23.0% |
| 5 | FTEC | Technology | 22.0% |
| 6 | IYM | Materials | 20.3% |
| 7 | XLI | Industrials | 19.2% |
| 8 | FIDU | Industrials | 18.5% |
| 9 | IYF | Financials | 18.1% |
| 10 | FUTY | Utilities | 16.2% |
The key observation from this ranking is that even the best-performing broad sector ETFs lagged well behind industry-focused funds, reinforcing that construction differences at the sector level were not sufficient to close the performance gap.
Industry and Niche Sector ETFs: Concentration Was the Advantage
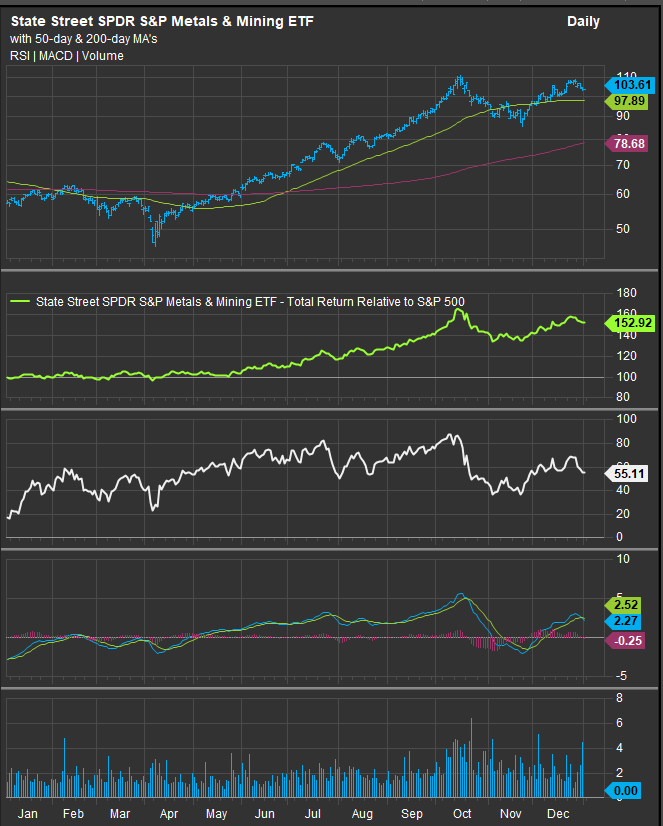
The most decisive performance outcomes within ETFSector.com’s Sector Fund Universe came from industry and niche sector ETFs. These funds benefited from intentional concentration, heavier exposure to capital spending cycles, and alignment with long-duration structural themes. Semiconductor ETFs captured the explosive growth in AI compute demand and data-center investment, while aerospace and defense ETFs benefited from sustained geopolitical tension and multi-year procurement visibility. Metals and mining ETFs stood apart as beneficiaries of both inflation hedging and electrification-driven scarcity, combining macro tailwinds with operating leverage.
Unlike sector ETFs, which spread capital across dozens of heterogeneous business models, industry ETFs concentrated exposure in a narrow group of companies where earnings growth, pricing power, and capital intensity were all moving in the same direction. This concentration amplified returns and explains why performance gaps versus sector ETFs were so large.
Top 10 Sector / Industry / Niche ETFs (2025)
| Rank | Ticker | Focus | 2025 Return |
| 1 | XME | Metals & Mining | 83.3% |
| 2 | USD | Semiconductors (Levered) | 61.9% |
| 3 | SHOC | Semiconductors | 49.8% |
| 4 | FTXL | Semiconductors | 48.9% |
| 5 | ITA | Aerospace & Defense | 48.5% |
| 6 | XAR | Aerospace & Defense | 46.1% |
| 7 | SOXQ | Semiconductors | 42.9% |
| 8 | MISL | Aerospace & Defense | 41.2% |
| 9 | SOXX | Semiconductors | 40.6% |
| 10 | XNTK | Concentrated Technology | 38.0% |
The magnitude of these returns leaves little ambiguity: 2025 rewarded funds that concentrated exposure where capital spending and earnings momentum were strongest, even at the expense of diversification.
Conclusion
The performance patterns observed across ETFSector.com’s Sector Fund Universe in 2025 were not accidental. They were the natural outcome of a market defined by earnings concentration, capital intensity, and structural growth themes. Broad sector ETFs performed as expected, efficiently capturing market beta but diluting exposure to the year’s most powerful drivers. Differences among sector ETFs were primarily a function of index breadth and weighting. True outperformance came from industry and niche sector ETFs that intentionally embraced concentration and aligned holdings with the dominant economic forces of the year. Concentrated gains in 2025 raise the potential for mean-reversion in 2026 if new macro catalysts emerge. Earnings and incremental data are important, but momentum which defined 2025 is often about narratives. 2025 ends with the AI/Growth narrative facing a “prove it to me” moment. Investors should pay close attention to the behavior of real asset prices in the natural materials space for indications of further hedging against the big Growth narratives that have defined the cycle from 2023-2025.
Data from this report was compiled through FactSet Research Systems Inc.
